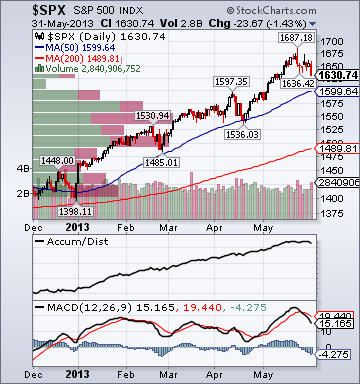
S&P 500 1,630.74 -1.20%*
The Weekly Wrap by Briefing.com.
*5-Day Change
Indices
- Russell 2000 984.14 -.01%
- S&P 500 High Beta 25.50 -.51%
- Value Line Geometric(broad market) 425.0 -.40%
- Russell 1000 Growth 744.63 -1.30%
- Russell 1000 Value 829.74 -1.03%
- Morgan Stanley Consumer 992.65 -2.32%
- Morgan Stanley Cyclical 1,219.17 -1.18%
- Morgan Stanley Technology 761.26 -.38%
- Transports 6,290.18 -2.17%
- Bloomberg European Bank/Financial Services 98.29 +1.60%
- MSCI Emerging Markets 41.86 -1.83%
- HFRX Equity Hedge 1,121.72 +.31%
- HFRX Equity Market Neutral 946.01 +.64%
Sentiment/Internals
- NYSE Cumulative A/D Line 189,948 -.60%
- Bloomberg New Highs-Lows Index 116 +192
- Bloomberg Crude Oil % Bulls 23.81 +8.82%
- CFTC Oil Net Speculative Position 257,139 -4.39%
- CFTC Oil Total Open Interest 1,744,717 +.15%
- Total Put/Call 1.18 -7.09%
- OEX Put/Call 2.05 +56.49%
- ISE Sentiment 97.0 +38.57%
- Volatility(VIX) 16.30 +15.85%
- S&P 500 Implied Correlation 55.15 -.11%
- G7 Currency Volatility (VXY) 10.22 +3.34%
- Emerging Markets Currency Volatility (EM-VXY) 9.76 +14.96%
- Smart Money Flow Index 12,097.22 -.56%
- Money Mkt Mutual Fund Assets $2.613 Trillion +.50%
Futures Spot Prices
- Reformulated Gasoline 275.49 -2.54%
- Heating Oil 278.14 -2.72%
- Bloomberg Base Metals Index 193.94 +1.31%
- US No. 1 Heavy Melt Scrap Steel 349.33 USD/Ton unch.
- China Iron Ore Spot 110.40 USD/Ton -10.4%
- UBS-Bloomberg Agriculture 1,505.91 +1.84%
Economy
- ECRI Weekly Leading Economic Index Growth Rate 6.6% -20 basis points
- Philly Fed ADS Real-Time Business Conditions Index -.3444 +4.65%
- S&P 500 Blended Forward 12 Months Mean EPS Estimate 115.92 +.17%
- Citi US Economic Surprise Index -14.40 +.9 point
- Citi Emerging Markets Economic Surprise Index -47.10 +3.9 points
- Fed Fund Futures imply 44.0% chance of no change, 56.0% chance of 25 basis point cut on 6/19
- US Dollar Index 83.37 -.32%
- Euro/Yen Carry Return Index 136.02 -.43%
- Yield Curve 183.0 +7 basis points
- 10-Year US Treasury Yield 2.13% +12 basis points
- Federal Reserve's Balance Sheet $3.342 Trillion -.43%
- U.S. Sovereign Debt Credit Default Swap 27.75 -8.29%
- Illinois Municipal Debt Credit Default Swap 123.0 +3.36%
- Western Europe Sovereign Debt Credit Default Swap Index 82.50 +1.11%
- Emerging Markets Sovereign Debt CDS Index 199.50 +6.06%
- Israel Sovereign Debt Credit Default Swap 120.0 +2.46%
- China Blended Corporate Spread Index 366.0 -42 basis points
- 10-Year TIPS Spread 2.19% -6 basis points
- TED Spread 25.0 +1.25 basis points
- 2-Year Swap Spread 16.25 +.25 basis point
- 3-Month EUR/USD Cross-Currency Basis Swap -14.25 -.25 basis point
- N. America Investment Grade Credit Default Swap Index 77.45 +2.59%
- European Financial Sector Credit Default Swap Index 146.69 +3.05%
- Emerging Markets Credit Default Swap Index 279.13 +7.39%
- CMBS AAA Super Senior 10-Year Treasury Spread to Swaps 100.0 -6 basis points
- M1 Money Supply $2.524 Trillion +.19%
- Commercial Paper Outstanding 1,047.80 +1.40%
- 4-Week Moving Average of Jobless Claims 347,300 +7,800
- Continuing Claims Unemployment Rate 2.3% unch.
- Average 30-Year Mortgage Rate 3.81% +22 basis points
- Weekly Mortgage Applications 721.40 -8.80%
- Bloomberg Consumer Comfort -29.7 -.3 point
- Weekly Retail Sales +2.60% unch.
- Nationwide Gas $3.61/gallon -.04/gallon
- Baltic Dry Index 809.0 -2.29%
- China (Export) Containerized Freight Index 1,035.04 -2.16%
- Oil Tanker Rate(Arabian Gulf to U.S. Gulf Coast) 25.0 -16.7%
- Rail Freight Carloads 248,210 -.78%
Best Performing Style
Worst Performing Style
Leading Sectors
Lagging Sectors
Weekly High-Volume Stock Gainers (10)
- STEI, SFD, HMA, NVE, INFN, EXPR, SHOS, BOFI, TFM and CRUS
Weekly High-Volume Stock Losers (10)
- FXCM, WPC, BXMT, WWAV, KMB, BAH, AEC, IRC, BIG and ENOC
Weekly Charts
ETFs
Stocks
*5-Day Change
Broad Market Tone:
- Advance/Decline Line: Lower
- Sector Performance: Most Sectors Declining
- Market Leading Stocks: Underperforming
Equity Investor Angst:
- ISE Sentiment Index 121.0 +27.37%
- Total Put/Call 1.13 +31.40%
Credit Investor Angst:
- North American Investment Grade CDS Index 78.67 +3.08%
- European Financial Sector CDS Index 146.68 +1.45%
- Western Europe Sovereign Debt CDS Index 82.50 +1.0%
- Emerging Market CDS Index 275.21 +2.64%
- 2-Year Swap Spread 16.25 -.25 bp
- 3-Month EUR/USD Cross-Currency Basis Swap -14.25 unch.
Economic Gauges:
- 3-Month T-Bill Yield .03% unch.
- China Import Iron Ore Spot $110.40/Metric Tonne -1.08%
- Citi US Economic Surprise Index -14.40 +4.7 points
- 10-Year TIPS Spread 2.19 +3 bps
Overseas Futures:
- Nikkei Futures: Indicating -181 open in Japan
- DAX Futures: Indicating -10 open in Germany
Portfolio:
- Higher: On gains in my retail sector longs, index hedges and emerging markets shorts
- Disclosed Trades: Added to my (IWM)/(QQQ) hedges
- Market Exposure: Moved to 25% Net Long
Bloomberg:
- Euro-Area Jobless Rate Rises to Record Amid Recession: Economy. The euro-area jobless rate rose to 12.2 percent from 12.1
percent in March, the European Union’s statistics office in Luxembourg
said today. That’s in line with the median of 37 economists’ estimates
in a Bloomberg News survey. Inflation accelerated in May to 1.4 percent,
led by rising prices for food and services, a separate report showed.
- Russia Stocks Drop to 5-Week Low as Crude Slumps, Banks Retreat. Russian
equities fell to a five-week low, extending a fourth-straight monthly
drop as crude oil tumbled and the nation’s biggest lenders declined. The
Micex Index (INDEXCF) retreated 0.8 percent to 1,350.48 by 11:41
a.m. in Moscow, poised for a 2.5 percent drop in the month.
Financial stocks led the declines among industry groups along
with utilities, losing 1.2 percent on average.
- Brazil Real Touches Lowest in Four Years, Spurring Intervention.
Brazil’s real declined to its weakest level in four years, spurring the
central bank to intervene in the foreign-exchange market for the first
time since March to
bolster the currency. The real pared its drop as the central bank sold
17,600 out
of 30,000 currency swap contracts worth $877 million. Yields on
interest-rate futures contracts rose the most in four years
after policy makers unexpectedly stepped up the pace of
increases in borrowing costs on May 29, saying inflation was
undermining the economic recovery.
“Today, it’s less about the level of the real and more the
pace of the move,” Flavia Cattan-Naslausky, a strategist at
Royal Bank of Scotland Group Plc, said in a telephone interview
from Stamford, Connecticut. “That made the central bank
nervous.
- Junk Bonds Losing 0.3 Percent in May to Snap 11 Months of Gains. Junk bonds are headed for their first
monthly loss in a year as dealers take on more of the debt amid
rising yields and a record pace of issuance. Dollar-denominated speculative-grade bonds have declined
0.3 percent in May after returning 15.4 percent the previous 11
months, according to Bank of America Merrill Lynch index data.
- Regulators Said Set to Decide Systemically Risky U.S. Non-Banks. U.S. regulators plan to vote next
week on whether to label some non-bank companies a potential
risk to the financial system, a move that would put them under
heightened Federal Reserve supervision, according to three
people familiar with the matter.
- Oil Heads for Monthly Drop as OPEC Keeps Output Target.
West Texas Intermediate crude
dropped, heading for a second monthly decline, as OPEC kept its
output target unchanged for a third consecutive time and U.S.
inventories climbed to the highest level in 82 years. Futures fell as
much as 1.7 percent after the Organization
of Petroleum Exporting Countries maintained its objective of 30 million
barrels a day at a meeting in today in Vienna. Ministers from the
12-member group will next gather on Dec. 4. U.S. crude supplies increased 3 million barrels to 397.6 million last week,
the most since 1931, a government report showed yesterday.
CNBC:
Zero Hedge:
Business Insider:
Denver Post:
ValueWalk:
- 100 Largest Hedge Funds Manage 61% Of Industry Capital. The
mean AUM of the top 100 hedge funds is a little under
$13.9 billion. Seventeen of the 100 largest hedge funds have AUM of
more than $20 billion. About 75% of the of the top 100 hedge funds are
based in the United States. A study conducted by Preqin reveals that
the top 100 hedge funds manage about 61 percent of the hedge fund
industry’s total capital. Preqin says in its May edition of Hedge Fund
Spotlight that hedge funds currently have about $2.3 trillion of assets
under management, of that $1.4 trillion is managed by the top 100 hedge
funds.
Forbes:
Reuters:
- Some Italian banks risk problems, central bank chief says. Some
Italian banks face probable difficulties and shareholders must be ready
to dilute their stakes and encourage mergers, the country's central
bank governor said on Friday. Bank of Italy Governor Ignazio Visco
said in a keynote speech that Italy's banks had been weakened by the
euro zone's sovereign debt crisis and ensuing
recession and some are now "at risk of being in difficulty." Visco did
not specify which banks he was referring to.
- Brazil stocks falls more than 2 pct, economic growth concerns.
- METALS-Copper slips on uncertainty ahead of China factory report.
- Portugal union calls strike against government austerity. Portugal's largest labour union
has called a general anti-government strike for June 27 to
protest against public sector pay cuts, layoffs and other
austerity measures imposed to meet EU/IMF bailout terms. The strike will encompass workers in the country's public
and private sectors, CGTP chief Armenio Carlos told reporters on
Friday, adding that all other unions were welcome to join.
- Stimulus concerns push Europe shares to 1-mth closing low. European shares slid to a
one-month closing low on Friday, hit by profit taking at the end
of a 12th straight month of gains and after strong U.S. data
reignited concerns about a cut in stimulus measures there. The FTSEurofirst 300 index finished 0.9 percent
down at 1,216.17 points, the lowest close since early May.
- EURO DEBT SUPPLY-Spain borrowing costs seen up in edgy market. Spanish borrowing costs will
likely rise at bond sales next week as concern over when the
U.S. Federal Reserve might scale back its economic stimulus
brakes a rally in riskier assets.
- INVESTMENT FOCUS-Sell emerging markets in May, and maybe June and July too.
Real Clear Markets:
Telegraph:
Valor Economico:
- Brazil Govt Sees GDP Growth of Less Than 3% in 2013. Inflation remains main concern of govt.
The Economic Times:
- BSE Sensex tanks 455 pts as RBI comment, GDP scare mkt. MUMBAI:
Stocks collapsed today with the BSE benchmark Sensex tumbling by 455
points -- the biggest drop in 15 months -- to end below 20,000 mark on
on frantic selling after RBI's poor inflation outlook and GDP falling to
decade's low came as double whammy to investors betting on rate cut.
Investor wealth fell by a whopping Rs 1.1 lakh crore as across market
1,600 scrips ended lower out the 2,500 traded. Stocks in realty, oil
& gas, banks, FMCG and PSUs bore the maximum brunt of selling as
12 out of 13 indices closed down. The 30-share Sensex resumed lower and
remained in negative terrain
throughout the day to settle at one-week low of 19,760.30, a fall of
455.10 points or 2.25 per cent. This is its worst drop since 478-point
fall on February 27, 2012.
Style Underperformer:
Sector Underperformers:
- 1) Gold & Silver -2.35% 2) Coal -1.50% 3) Steel -1.44%
Stocks Falling on Unusual Volume:
- TI, TLK, IBN, HDB, E, PBR, MRCY, WIT, BODY, PANW, UNXL, CPRT, ESL, PLL, CPHD, ESD, LINE, ADS, BBL, BXMT, LNCO, PHG, HMC, AIG, EXL, KMP, HSY, ARCP, EFC, ASML, ROG, OXY and ELP
Stocks With Unusual Put Option Activity:
- 1) SFD 2) AKS 3) JNK 4) MON 5) EWJ
Stocks With Most Negative News Mentions:
- 1) MU 2) GS 3) F 4) VMW 5) DISCA
Charts:
Style Outperformer:
Sector Outperformers:
- 1) Hospitals +1.55% 2) Disk Drives +1.06% 3) Retail +.92%
Stocks Rising on Unusual Volume:
- NBG, GES, SGI, ZLC, INFN, OVTI, KKD, LGF, HMA, AEGR, TROX, SWKS, CYH, PNK and AFCE
Stocks With Unusual Call Option Activity:
- 1) PANW 2) TIF 3) CPRT 4) TEX 5) XLU
Stocks With Most Positive News Mentions:
- 1) AWAY 2) CP 3) LOW 4) MS 5) CRM
Charts:
