Saturday, February 18, 2017

Today's Headlines

Bloomberg:
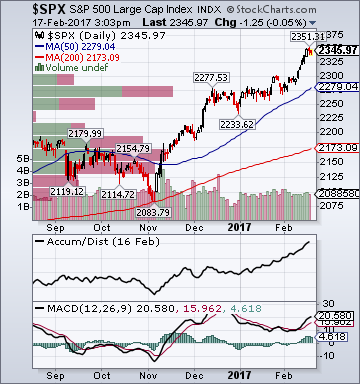
  • Trump Rally Inches Forward as Banks Lead Fourth Weekly Advance. U.S. stocks climbed for the fourth straight week as financial companies rallied, economic data beat expectations and corporate earnings continued to show profit growth. Banks posted their biggest-five day gain this year as the 10-year yield climbed and Federal Reserve chair Janet Yellen told Congress more interest-rate hikes would be appropriate if the economy stays on course. The S&P 500 Index added 1.5 percent to a record 2,351.16. The The Dow Jones Industrial Average jumped 1.8 percent to 20,624.05. The Nasdaq Composite Index ended the week at an all-time high as health-care and phone stocks in the gauge rallied.
  • Russia Watches U.S. Reassure Allies, and It's Disappointed. Shortly after Vice President Mike Pence pledged to “hold Russia to account” while looking for common ground in a speech to European allies, a hawkish Russian legislator reached out to shake his hand as he passed through a crowded hotel corridor. “Mr. Vice President, I am from Moscow and we hope we will reach those arrangements you were talking about,” said Alexei Pushkov, a member of the defense committee in the upper chamber of the Russian parliament. He enthusiastically told reporters afterward that he saw the Vice President’s smile as a good sign.
  • U.S. Coal Mines Are Opening in a Year of 'Cautious Optimism'. There’s newfound optimism in America’s coalfields with spot prices for metallurgical coal -- the sort used in steelmaking -- twice as high as they were a year ago. China curtailing its own production and tightening seaborne markets helped stoke a rally last year. President Donald Trump is now promising to bring coal jobs back, making his first move this week to roll back Obama-era environmental regulations that targeted the sector.
Wall Street Journal:
Barron's:
  • Had bullish commentary on (VSAR), (GBT), (NBIX), (FOLD), (BIIB), (GILD), (ADNT), (GM), (ANTM), (SYF) and (HES).

Friday, February 17, 2017

Market Week in Review

  • S&P 500 2,346.39 +1.27%*
 photo thy_zpsdom6baeo.png

The Weekly Wrap by Briefing.com.

*5-Day Change

Weekly Scoreboard*


Indices
  • S&P 500 2,346.39 +1.27%
  • DJIA 20,574.10 +1.53%
  • NASDAQ 5,826.80 +1.64%
  • Russell 2000 1,397.72 +.62%
  • S&P 500 High Beta 38.19 +.47%
  • Goldman 50 Most Shorted 121.89 -1.11%
  • Wilshire 5000 24,393.15 +1.20%
  • Russell 1000 Growth 1,124.29 +1.25%
  • Russell 1000 Value 1,137.56 +1.18%
  • S&P 500 Consumer Staples 558.13 +1.57%
  • Vanda Cyclicals-Defensives 1.3161 +1.51%
  • Morgan Stanley Technology 1,347.33 +1.60%
  • Transports 9,472.88 +.84%
  • Utilities 669.72 +.05%
  • Bloomberg European Bank/Financial Services 94.85 +1.49%
  • MSCI Emerging Markets 38.31 +.77%
  • HFRX Equity Hedge 1,185.30 +.81%
  • HFRX Equity Market Neutral 998.35 +.24%
Sentiment/Internals
  • NYSE Cumulative A/D Line 282,698 +.81%
  • Bloomberg New Highs-Lows Index 843 +243
  • Bloomberg Crude Oil % Bulls 20.6 +11.8%
  • CFTC Oil Net Speculative Position 476,990 -3.19%
  • CFTC Oil Total Open Interest 2,191,158 +.44%
  • Total Put/Call .99 +1.02%
  • OEX Put/Call .26 -68.7%
  • ISE Sentiment 80.0 +10.0%
  • NYSE Arms 1.10 +1.80%
  • Volatility(VIX) 11.54 +6.45%
  • S&P 500 Implied Correlation 46.20 -3.1%
  • G7 Currency Volatility (VXY) 10.35 -4.34%
  • Emerging Markets Currency Volatility (EM-VXY) 9.79 -3.83%
  • Smart Money Flow Index 19,699.59 +1.46%
  • ICI Money Mkt Mutual Fund Assets $2.675 Trillion -.08%
  • ICI US Equity Weekly Net New Cash Flow -$.031 Billion
  • AAII % Bulls 33.1 -7.6%
  • AAII % Bears 32.4 +17.0%
Futures Spot Prices
  • CRB Index 191.80 -1.11%
  • Crude Oil 53.18 -1.32%
  • Reformulated Gasoline 150.76 -5.75%
  • Natural Gas 2.84 -5.57%
  • Heating Oil 162.68 -2.32%
  • Gold 1,239.10 +.36%
  • Bloomberg Base Metals Index 180.03 +.26%
  • Copper 270.55 -2.65%
  • US No. 1 Heavy Melt Scrap Steel 260.0 USD/Ton -6.92%
  • China Iron Ore Spot 90.37 USD/Ton +4.33%
  • Lumber 364.30 -1.63%
  • UBS-Bloomberg Agriculture 1,189.20 -1.18%
Economy
  • Atlanta Fed GDPNow Forecast +2.4% -30.0 basis points
  • ECRI Weekly Leading Economic Index Growth Rate +11.1% -70.0 basis points
  • Philly Fed ADS Real-Time Business Conditions Index -.0851 +5.97%
  • S&P 500 Blended Forward 12 Months Mean EPS Estimate 132.69 +.11%
  • Citi US Economic Surprise Index 53.10 -12.3 points
  • Citi Eurozone Economic Surprise Index 41.50 -10.3 points
  • Citi Emerging Markets Economic Surprise Index 42.10 +3.5 points
  • Fed Fund Futures imply 68.0% chance of no change 32.0% chance of 25 basis point hike on 3/15
  • US Dollar Index 100.89 +.18%
  • MSCI Emerging Markets Currency Index 1,563.49 +.84%
  • Euro/Yen Carry Return Index 125.03 -.53%
  • Yield Curve 122.0 unch.
  • 10-Year US Treasury Yield 2.42% +1.0 basis point
  • Federal Reserve's Balance Sheet $4.416 Trillion -.03%
  • U.S. Sovereign Debt Credit Default Swap 27.22 -9.34%
  • Illinois Municipal Debt Credit Default Swap 404.0 -.07%
  • Western Europe Sovereign Debt Credit Default Swap Index 22.0 -9.65%
  • Asia Pacific Sovereign Debt Credit Default Swap Index 27.04 -6.49%
  • Emerging Markets Sovereign Debt CDS Index 67.45 -3.07%
  • Israel Sovereign Debt Credit Default Swap 67.43 -.79%
  • Iraq Sovereign Debt Credit Default Swap 601.42 -7.8%
  • Russia Sovereign Debt Credit Default Swap 176.25 +.20%
  • iBoxx Offshore RMB China Corporate High Yield Index 134.60 +.19%
  • 10-Year TIPS Spread 2.02% +2.0 basis points
  • TED Spread 54.0 +4.0 basis points
  • 2-Year Swap Spread 36.25 +5.0 basis points
  • 3-Month EUR/USD Cross-Currency Basis Swap -25.75 +.25 basis point
  • N. America Investment Grade Credit Default Swap Index 64.12 -1.35%
  • America Energy Sector High-Yield Credit Default Swap Index 377.0 -.3%
  • European Financial Sector Credit Default Swap Index 92.49 -1.30%
  • Emerging Markets Credit Default Swap Index 227.09 -1.79%
  • CMBS AAA Super Senior 10-Year Treasury Spread to Swaps 139.0 +1.5 basis points
  • M1 Money Supply $3.335 Trillion -2.0%
  • Commercial Paper Outstanding 965.30 -.1%
  • 4-Week Moving Average of Jobless Claims 245,250 +1,000
  • Continuing Claims Unemployment Rate 1.5% unch.
  • Average 30-Year Mortgage Rate 4.15% -2.0 basis points
  • Weekly Mortgage Applications 379.0 -3.71%
  • Bloomberg Consumer Comfort 48.1 +.9 point
  • Weekly Retail Sales +.8% +10.0 basis points
  • Nationwide Gas $2.29/gallon +.02/gallon
  • Baltic Dry Index 710.0 +1.14%
  • China (Export) Containerized Freight Index 845.43 -3.24%
  • Oil Tanker Rate(Arabian Gulf to U.S. Gulf Coast) 40.0 unch.
  • Rail Freight Carloads 264,761 -2.47%
Best Performing Style
  • Large-Cap Growth +1.1%
Worst Performing Style
  • Small-Cap Value +.4%
Leading Sectors
  • Biotech +3.2%
  • Banks +3.1%
  • Steel +3.0%
  • Drugs +2.6%
  • Social Media+2.5%
Lagging Sectors
  • Energy -2.5% 
  • Gold & Silver -2.7%
  • Oil Service -2.7%
  • Tobacco -3.3%
  • Gaming -3.9%
Weekly High-Volume Stock Gainers (32)
  • EDIT, SAGE, CTRL, GBT, INFN, CYNO, KATE, NSP, ZLTQ, RPD, OMF, ICPT, ATVI, ON, TOWR, BG, DBD, TRU, AYR, PGNX, SSNC, RNG, PBPB, SCI, MYGN, CTB, MASI, SBCF, MPO, MJN, HMHC and WYN
Weekly High-Volume Stock Losers (21)
  • ZTS, MGM, FLO, WEX, VDSI, TRIP, HAIN, HAWK, SYNT, HIBB, FOSL, CRY, KNL, FET, BGFV, INT, YELP, MOH, PHH, UBNT and ECOM
Weekly Charts
ETFs
Stocks
*5-Day Change