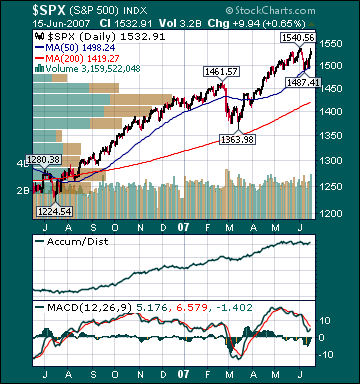
S&P 500 1,532.91 +1.67%*
Click here for What a Week by TheStreet.com.
BOTTOM LINE: Overall, last week's market performance was very bullish. The NYSE cumulative advance/decline line rose, almost every sector gained and volume was above average on the week. Measures of investor anxiety finished the week above average levels, despite the exceptional gains in stocks. The AAII percentage of bulls fell to 37.30% this week from 40.59% the prior week. This reading is still well below average levels. The AAII percentage of bears rose to 43.65% this week from 42.57% the prior week. This reading is still approaching elevated levels. These pessimistic readings come even as the DJIA is just off one of its most prolific winning streaks in history and is just 0.17% off its all-time high. Moreover, the 10-week moving average of the percentage of bears is currently 40.9%, an elevated level. The 10-week moving average of the percentage of bears peaked at 43.0% at the major bear-market low during 2002. Moreover, the 50-week moving average of the percentage of bears is currently 37.3%, a very high level seen during only two other periods since tracking began in the 1980s. Those periods were October 1990-July 1991 and March-May 2003, both of which were near major market bottoms.
The extreme readings in the 50-week moving average of the percentage of bears, during those periods, peaked at 41.6% on Jan. 31, 1991, and 38.1% on April 10, 2003. We are still very close to eclipsing the peak in bearish sentiment during the 2000-03 market meltdown, which is astonishing considering the macro backdrop now and then.
I continue to believe that steadfastly high bearish sentiment in many quarters is mind-boggling for the following reasons:
· the 27.6% rise in the S&P 500 over the last year,
· the 108.6% gain(16.9% annualized) for the S&P 500 since the 2002 major bear market lows,
· a recent new record high for the NYSE cumulative advance/decline line,
· all market-caps and styles participating,
· one of the best August/September/October market runs in
· the
· we are in the early stages of what is historically a very strong period for
As well, despite recent gains, the forward P/E on the S&P 500 is a very reasonable 16.3, right near where it began the year, due to the historic run of double-digit profit growth increases and better-than-expected earnings guidance in the first quarter. The S&P P/E multiple has contracted for three consecutive years. It has only contracted four consecutive years two times since 1905. Each point of multiple expansion is equivalent to a 6.6% gain in the S&P 500. I strongly suspect we will finally see expansion this year. The many bears still remain stunningly complacent, in my opinion.
As I have said many times over the past year, it seems every pullback is seen as a major top by the bears, and every move higher is just another shorting/selling opportunity. I see few signs of capitulation by the bears, and their ranks remain historically crowded given recent gains. Even most bulls seem to want the market to decline to redeploy cash they raised in anticipation of a meaningful correction. I still sense very few investors believe the market has meaningful upside from current levels and are positioned accordingly.
As well, there are many other indicators registering high levels of investor anxiety. The Yale School of Management Crash Confidence Index is showing the individual is currently the most concerned about a stock market crash since December 2002, right near the trough of one of the worst bear markets in
There has been a historic explosion of hedge funds created with absolute return, low correlation or negative correlation
According to the latest Conference Board reading, consumer confidence in the northern part of the country, where most major investment funds and media outlets are located, remains depressed near the 2000-03 major bear market lows. A short-sighted day-trading pessimistic mentality has thoroughly permeated the investment landscape. Research boutiques with a negative bias have sprung up to cater to these many new funds that help pump air into the current
Given the current historic pessimism with the DJIA fresh off record highs, I suppose the many with a bearish agenda will only be happy when every last investor and viewer is permanently driven away. Moreover, the many new Permabears, or "fearleaders," are still more widely followed than ever, despite the market's triple-digit percentage gain from the major bear-market lows. At this major market bottom, permabulls, or "cheerleaders," had been shunned and chastised for a couple of years. Moreover, Wall Street analysts have made the fewest buy calls on stocks this year since Bloomberg began tracking in 1997. Buy calls have been trending lower for the last year, despite the huge rally in stocks.
According to TickerSense.com, investment blogger sentiment remains pessimistic at 32.35% bears, 26.47% bulls. The UltraShort QQQ ProShares (QID) continue to see soaring volume. There is still a very high wall of worry for stocks to climb substantially from current levels as the public and many professionals remain very skeptical of this bull market and continue to trade with one foot out the door.
I continue to believe this is a direct result of the strong belief by the “herd” that the
It's hard to believe that, after the bombardment of pessimism, depression comparisons and "crash" calls that occurred in March, the average
I continue to believe that a significant portion of this cash will be deployed into true growth companies as their outperformance vs. value stocks gains steam throughout the year. I am already seeing signs that this is starting to happen. As well, Chinese investors may be a new source of demand for
The average 30-year mortgage rate rose 19 basis points this week to 6.74%, which is 6 basis points below July 2006 highs. There is still mounting evidence that the worst of the housing downturn is over, despite recent worries over sub-prime lending, and that sales activity is stabilizing at relatively high levels. Even after the recent slide, existing home sales are still 10.3% above the peak during the late-90s stock market bubble. About 14% of total mortgage loans are sub-prime. Of those 14%, another 13.77% are delinquent. Thus, only about 2% of total mortgage loans outstanding are currently problematic. I do not believe sub-prime woes are nearly large enough or will become large enough to meaningfully impact the prime market and bring down the
Moreover, the Fed’s Bernanke said recently that the prime market is still strong and that he sees no spillover from the sub-prime problems. As well, the Fed’s
Mortgage applications jumped 6.6% this week and continue to trend higher with the rising stock market and healthy job market. Furthermore, the 10-week moving average of purchase applications is at the highest level in 16 months. The Mortgage Bankers Association reiterated recently that the
The Housing Sector Index(HGX) has risen 20.7% from July 2006 lows. The Case-Shiller housing futures have improved and are now projecting only a 2.1% decline in the average home price through November, up from projections of a 4.0% decline 3 months ago. Considering the median house has appreciated over 50% during just the last few years with record high US home ownership, this would be considered a “soft landing.” Furthermore, the Case-Shiller Housing Index is 127.3% higher over the last decade.
I continue to believe the many U.S. stock market bears are exaggerating, in every media outlet possible, the overall impact of housing on the economy in hopes of scaring investors, consumers and the government into a panicked state, thus making the problems worse than would otherwise be the case. Housing activity and home equity extractions had been slowing substantially for over 2 years and the negative effects were mostly offset by many other very positive aspects of the
Home values are more important than stock prices to the average American, but the median home has barely declined in value after a historic run-up, while the S&P 500 has risen 27.6% over the last year and 108.6% since the Oct. 4, 2002 major bear market low. Americans’ median net worth is hitting new record high levels as a result, a fact that is generally unrecognized or minimized by the record number of stock market participants that feel it is in their financial and/or political interests to paint a bleak picture of
Moreover, unemployment is low by historic standards, interest rates are low, inflation is below average rates and wages are rising at above-average rates. The economy has created about 2 million jobs in the last year. As well, the Monster Employment Index hit another record high in May. The 50-week moving average of initial jobless claims has been lower during only two other periods since the 70s. Finally, the unemployment rate is a historically low 4.5%, down from 5.1% in September 2005, notwithstanding fewer real estate-related jobs and significant auto production cutbacks. The unemployment rate’s current 12-month average is 4.6%. It has only been lower during two other periods since the mid-50s.
The Consumer Price Index for May rose 2.7% year-over-year, down from a 4.7% increase in September of 2005. This is below the 20-year average of 3.1%. Moreover, the CPI has only been lower during four other periods since the mid-1960s. Several other measures of inflation are still below long-term average rates. The Fed’s preferred inflation gauge, the PCE Core, rose 2.0% year-over-year in April versus the 20-year average of 2.5%. Furthermore, most measures of Americans’ income growth are now almost twice the rate of inflation. Americans’ Average Hourly Earnings rose 3.8% year-over-year in May, substantially above the 3.2% 20-year average. The 10-month moving-average of Americans’ Average Hourly Earnings is currently 4.03%. 1998 was the only year during the 90s expansion that it exceeded current levels.
The benchmark 10-year T-note yield rose 5 basis points for the week on more economic optimism. According to Intrade.com, the chances of a
While the drag from housing is subsiding, housing activity will not add to economic growth in any meaningful way this year as homebuilders continue to reduce inventories and sales stabilize at lower, but still relatively high by historic standards, levels. I still expect a smaller GDP deflator, inventory rebuilding, rising auto production, increased business spending and a still healthy service sector to boost
Manufacturing accounts for roughly 12% of US economic growth, while consumer spending accounts for about 70% of growth.
Weekly retail sales rose 1.7% last week vs. a 2.2% gain the prior week. However, retail sales for May, reported this week, jumped 1.4%, the most in 16 months. The job market remains healthy, housing has improved modestly, wage growth has accelerated, stocks are substantially higher and inflation has decelerated to below average rates. These positives continue to more than offset the negatives from housing and record gas prices. Finally, I expect consumer confidence to make new cycle highs later this year as gas prices fall, the job market remains healthy, stocks rise further, home sales stabilize at relatively high levels, inflation decelerates more and interest rates remain low. This should help sustain healthy consumer spending over the intermediate-term.
Just take a look at commodity charts, gauges of commodity sentiment and inflows into commodity-related funds over the last couple of years. Net assets invested in the Goldman Sachs Commodity Index rose to almost $70 billion in 2006 from $15 billion in 2003. There has been a historic mania for commodities by investment funds that has pushed prices significantly higher than where the fundamentals dictate. That mania is now in the stages of unwinding. The CRB Commodities Index, the main source of inflation fears has declined -5.4% over the last 12 months and -11.7% from May 2006 highs despite a historic flood of capital into commodity-related funds and numerous potential upside catalysts. Oil has declined $10/bbl from July 2006 highs. As well, this year oil plunged $12/bbl. over the first 18 days of trading at the beginning of the year. Last year, oil rose $2.05/bbl. on the first trading day of the year and $7.40/bbl. through the first three weeks of trading as commodity funds, flush with new capital, drove futures prices higher.
I suspect, given the average commodity hedge fund fell around double-digits last year as the CRB Index dropped -7.4%, that many energy-related funds saw outflows at year-end. Recent reports have also indicated that institutional investors are switching from commodity funds that trade energy futures to hedge funds that buy energy-related equities. The commodity mania has also pumped air into the current
The EIA reported this week that gasoline supplies rose less than expectations as refineries remain very slow to come back online after a recent historical rash of “outages.” Refinery utilization is currently 89.2%, a 15-year low for this time of the year and below levels seen in the same week of 2006 after the historic hurricanes in 2005 destroyed energy infrastructure in the
Gasoline futures rose substantially for the week as investment fund speculation rose on extraordinarily low refinery utilization. However, gasoline futures are still down 22.1% from September 2005 highs. The gasoline crack spread rose this week and remains at levels seen during hurricane Katrina’s aftermath. It is interesting to note that crack spreads peaked last August right before oil plunged $28/bbl. in less than six months. It is also interesting to note that commercial hedgers, historically the “smart money”, continue to maintain their net short oil position into the recent historic spike in crack spreads, which is highly unusual. Temporary refinery “outages” are still helping to prop up the entire energy complex. However, the very elevated level of current gas prices will only further dampen global fuel demand, sending gas prices substantially lower over the intermediate-term.
The 10-week moving-average of
As well, worldwide oil inventories are poised to begin increasing at an accelerated rate over the next year. There is a very fine line in the crude oil market between perceptions of "significantly supply constrained" and "massive oversupply." One of the main reasons I believe OPEC has been slow to actually meet their pledged cuts has been the fear of losing market share to non-OPEC countries. Moreover, OPEC actually needs lower prices to prevent any further long-term demand destruction. I continue to believe oil is priced at elevated levels on record speculation by investment funds, not the fundamentals.
The Amaranth Advisors hedge fund blow-up last year was a prime example of the extent to which many investment funds have been speculating on ever higher energy prices through futures contracts, thus driving the price of the underlying commodity to absurd levels for consumers and businesses. This is considered “paper demand”, which is not real demand for the underlying commodity. Amaranth, a multi-strategy hedge fund, lost about $6.5 billion of its $9.5 billion under management in less than two months speculating mostly on higher natural gas prices. I continue to believe a number of other funds will experience similar fates over the coming months after managers “pressed their bets” in hopes of making up for recent poor performance, which will further pressure energy prices as these funds unwind their leveraged long positions to meet rising investor redemptions. Moreover, the same rampant speculation that has driven the commodity mania will work against energy as downside speculation increases and drives down prices even further than the fundamentals would otherwise dictate.
Cambridge Energy Research, one of the most respected energy research firms in the world, put out a report late last year that drills gaping holes in the belief by most investors of imminent "peak oil" production. Cambridge said that its analysis indicates that the remaining global oil base is actually 3.74 trillion barrels, three times greater than "peak oil" theory proponents say and that the "peak oil" theory is based on faulty analysis. I suspect the substantial contango that still exists in energy futures, which encourages hoarding, will begin to reverse over the coming months as more investors come to the realization that the "peak oil" theory is hugely flawed, global crude storage tanks fill and Chinese/US demand slows further.
Global crude oil storage capacity utilization is running around 98%. OPEC production cuts have resulted in a complete technical breakdown in crude futures, despite the recent bounce. Spare production capacity, which had been one of the main sources of angst among the many oil bulls, rises with each OPEC cut. As well, demand destruction which is already pervasive globally will only intensify over the coming years as many more alternative energy projects now in the pipeline come to the fore. Moreover, many Americans feel as though they are helping fund terrorism or hurting the environment every time they fill up their gas tanks. I do not believe we will ever again see the demand for gas-guzzling vehicles that we saw in recent years, even if gas prices plunge further from current levels, as I expect. If OPEC actually implements all their announced production cuts, with oil still at very high levels and weakening global growth, it will only further deepen resentment towards the cartel and result in even greater long-term demand destruction.
I continue to believe oil made a major top last year during the period of historic euphoria surrounding the commodity with prices above $70/bbl. and calls for $100/bbl. oil commonplace. Even during the peak of anxiety in the recent Iranian/UK hostage stand-off, oil only rose about $6/bbl., despite renewed calls from numerous traders, analysts and pundits for $100+/bbl. oil. Falling demand growth for oil in emerging market economies, an explosion in alternatives, rising global spare production capacity, increasing global refining capacity, the complete debunking of the hugely flawed "peak oil" theory, a firmer U.S. dollar, less demand for gas guzzling vehicles, accelerating non-OPEC production, a reversal of the "contango" in the futures market, a smaller risk premium and essentially full global storage should provide the catalysts for oil to fall to $40 per barrel to $45 per barrel later this year. I fully expect oil to test $20 per barrel to $25 per barrel within the next three years as the historic investment fund speculation in the commodity reverses course.
Natural gas inventories rose around expectations this week. However, prices for the commodity rose even with supplies now 19.3% above the 5-year average and near all-time high levels for this time of year. Furthermore, the EIA recently projected global liquefied natural gas production to soar this year, with the
Gold rose modestly on the week as concerns over emerging markets’ demand continued to subside. Perceptions of emerging market demand for the metal seem to be the greatest determinant of prices at this point. Copper rose on better-than-expect
I continue to believe there is very little chance of another Fed rate hike anytime soon, notwithstanding the recent acceleration in economic activity. An eventual rate cut is still more likely this year as inflation continues to decelerate substantially. The recent rise in mortgage rates will likely mute the rebound in housing and prevent the overall economy from growing too fast. As well, the substantial inventory rebuilding that is taking place this quarter will likely begin subsiding in 3Q.
The
Current
The emerging markets’ mania, which has mainly been the by-product of the commodity mania, is likely nearing an end, as well. The Financial Times reported recently that
In my opinion,
The Shanghai Composite’s recent performance mirror’s that of the Nasdaq during the late 90s bubble. I am also keeping a close eye on the
S&P 500 profits have risen at double-digit rates for 19 consecutive quarters, the best streak since recording keeping began in 1936. Moreover, second quarter estimates are for a conservative 3.8% increase, which should be handily exceeded once again. Notwithstanding a 108.6% total return(which is equivalent to a 16.9% average annual return) for the S&P 500 since the October 2002 bottom, its forward p/e has contracted relentlessly and now stands at a very reasonable 16.3. The 20-year average p/e for the S&P 500 is 23.0.
In my opinion, the
A recent Citigroup report said that the total value of
Considering the overwhelming majority of investment funds failed to meet the S&P 500's 15.8% return last year, I suspect most portfolio managers have a very low threshold of pain this year for falling substantially behind their benchmark once again. Investment manager performance anxiety is likely quite elevated already this year as the major averages are on pace to exceed last year’s gains. The fact that last year the
I continue to believe the historically extreme readings in many gauges of investor angst during the last few months indicated the
No comments:
Post a Comment