Sunday, August 14, 2011

Weekly Outlook

Link
U.S. Week Ahead by MarketWatch (video).
Wall St. Week Ahead by Reuters.
Stocks to Watch Monday by MarketWatch.
Weekly Economic Calendar by Briefing.com.

BOTTOM LINE: I expect US stocks to finish the week mixed as US tax hike worries, financial sector pessimism, eurozone debt angst, global growth concerns and emerging market inflation fears offset short-covering, bargain-hunting and buyout/buyback speculation. My intermediate-term trading indicators are giving mostly bearish signals and the Portfolio is 75% net long heading into the week.

Friday, August 12, 2011

Market Week in Review


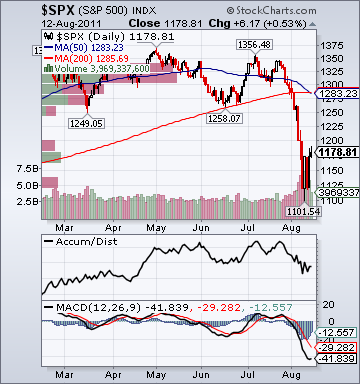
S&P 500 1,178.81 -1.72%*

Photobucket

The Weekly Wrap by Briefing.com.

*5-Day Change

Weekly Scoreboard*


Indices

  • S&P 500 1,178.81 -1.72%
  • DJIA 11,269.0 -1.53%
  • NASDAQ 2,507.98 -.96%
  • Russell 2000 697.50 -2.40%
  • Wilshire 5000 12,259.90 -1.57%
  • Russell 1000 Growth 533.30 -.87%
  • Russell 1000 Value 582.83 -2.12%
  • Morgan Stanley Consumer 690.35 -1.66%
  • Morgan Stanley Cyclical 881.21 -2.29%
  • Morgan Stanley Technology 581.28 -.95%
  • Transports 4,622.58 -1.51%
  • Utilities 411.21 -.85%
  • MSCI Emerging Markets 40.96 -4.74%
  • Lyxor L/S Equity Long Bias Index 980.83 -4.89%
  • Lyxor L/S Equity Variable Bias Index 866.81 -2.78%
  • Lyxor L/S Equity Short Bias Index 649.28 +6.65%
Sentiment/Internals
  • NYSE Cumulative A/D Line 118,241 -.69%
  • Bloomberg New Highs-Lows Index -558 +746
  • Bloomberg Crude Oil % Bulls 41.0 +57.7%
  • CFTC Oil Net Speculative Position 135,718 -7.91%
  • CFTC Oil Total Open Interest 1,564,480 +2.32%
  • Total Put/Call 1.09 -12.10%
  • OEX Put/Call 1.42 +13.60%
  • ISE Sentiment 96.0 +14.29%
  • NYSE Arms 1.15 +101.75%
  • Volatility(VIX) 36.36 +14.84%
  • G7 Currency Volatility (VXY) 13.28 +6.92%
  • Smart Money Flow Index 9,755.63 +.55%
  • Money Mkt Mutual Fund Assets $2.621 Trillion +2.10%
  • AAII % Bulls 33.43 +23.09%
  • AAII % Bears 44.78 -10.17%
Futures Spot Prices
  • CRB Index 326.53 -.08%
  • Crude Oil 85.37 -2.18%
  • Reformulated Gasoline 281.85 +.02%
  • Natural Gas 4.06 +2.86%
  • Heating Oil 291.07 -1.41%
  • Gold 1,748.60 +4.91%
  • Bloomberg Base Metals 239.70 -3.29%
  • Copper 402.0 -3.12%
  • US No. 1 Heavy Melt Scrap Steel 420.0 USD/Ton unch.
  • China Hot Rolled Domestic Steel Sheet 4,824 Yuan/Ton -.43%
  • UBS-Bloomberg Agriculture 1,687.73 +.57%
Economy
  • ECRI Weekly Leading Economic Index Growth Rate 1.7% -40 basis points
  • S&P 500 EPS Estimates 1 Year Mean 96.19 +.08%
  • Citi US Economic Surprise Index -79.10 -3.0 points
  • Fed Fund Futures imply 40.0% chance of no change, 60.0% chance of 25 basis point cut on 8/9
  • US Dollar Index 74.60 +.09%
  • Yield Curve 207.0 -20 basis points
  • 10-Year US Treasury Yield 2.26% -30 basis points
  • Federal Reserve's Balance Sheet $2.856 Trillion +.19%
  • U.S. Sovereign Debt Credit Default Swap 52.50 -5.22%
  • Illinois Municipal Debt Credit Default Swap 233.0 +16.01%
  • Western Europe Sovereign Debt Credit Default Swap Index 295.17 -.34%
  • Emerging Markets Sovereign Debt CDS Index 236.08 +10.9%
  • Saudi Sovereign Debt Credit Default Swap 105.42 +5.56%
  • Iraqi 2028 Government Bonds 85.71 -5.42%
  • 10-Year TIPS Spread 2.24% unch.
  • TED Spread 28.0 +1 basis point
  • N. America Investment Grade Credit Default Swap Index 114.55 +8.29%
  • Euro Financial Sector Credit Default Swap Index 208.44 +18.70%
  • Emerging Markets Credit Default Swap Index 275.60 +10.77%
  • CMBS Super Senior AAA 10-Year Treasury Spread 122.0 +23 basis points
  • M1 Money Supply $2.099 Trillion +5.04%
  • Business Loans 656.10 +95%
  • 4-Week Moving Average of Jobless Claims 405,000 -.80%
  • Continuing Claims Unemployment Rate 2.9% -10 basis points
  • Average 30-Year Mortgage Rate 4.32% -7 basis points
  • Weekly Mortgage Applications 688.0 +21.71%
  • Bloomberg Consumer Comfort -49.10 -1.5 points
  • Weekly Retail Sales +4.80% +50 basis points
  • Nationwide Gas $3.61/gallon -.09/gallon
  • U.S. Cooling Demand Next 7 Days 11.0% above normal
  • Baltic Dry Index 1,277 +.71%
  • Oil Tanker Rate(Arabian Gulf to U.S. Gulf Coast) 35.0 -6.67%
  • Rail Freight Carloads 235,568 -2.06%
Best Performing Style
  • Mid-Cap Growth +.14%
Worst Performing Style
  • Small-Cap Value -3.55%
Leading Sectors
  • Gold & Silver +5.35%
  • Steel +2.44%
  • REITs +2.23%
  • HMOs +1.50%
  • Coal +1.49%
Lagging Sectors
  • Homebuilders -4.67%
  • I-Banks -6.0%
  • Oil Tankers -6.70%
  • Banks -8.93%
  • Education -8.96%
Weekly High-Volume Stock Gainers (52)
  • MCHX, RES, CREE, BSFT, CF, MAKO, PANL, PEGA, MRX, QNST, LOPE, KELYA, CHD, CBOE, HUN, JOE, CNK, GET, RL, ATNI, VIA, AAON, CSCO, CNS, LMNX, DW, TDG, TRH, SUSS, HME, MG, ESS, PSA, AVB, EP, HHC, ABVT, APH, CNSL, UVV, EAT, PRGO, ICE, MFB, FRT, VGR, FFG, MRO, FLR, WERN, NDAQ and O
Weekly High-Volume Stock Losers (177)
  • ATPG, SIGI, DNB, NILE, COST, LORL, HD, PLOW, DSW, BLT, LFUS, ECOL, CPB, ANR, NFP, ORA, BF/B, REN, FFIC, KBW, ARO, OC, PL, NTLS, EBS, LUK, LNC, JLL, SIRO, CLNY, ABM, MTSC, MCO, PRK, SLE, CORE, NFG, HI, GVA, SHLD, GPRE, KWR, SUN, WFSL, PLT, LRN, AXE, ULTI, VLY, VRNT, BOKF, ASNA, CGX, AEL, ALC, STT, CHSP, EWBC, WABC, NAVG, PRGS, UPL, JW/A, IBI, TTWO, CAR, VMC, HST, APO, AH, COH, FICO, LHO, ATU, DIS, ACM, PEB, MET, NIHD, RMBS, OZRK, DRQ, NTRS, AIN, RWT, SPLS, KOP, APEI, TG, BID, ALEX, ALR, FII, CATY, PLFE, WBS, CSC, TOL, HAR, FMER, HR, MYRG, KOS, WMS, CYN, NSIT, DRE, EDMC, KALU, LBY, IILG, PHH, FCE/A, TDS, TSRA, TTMI, URS, C, DLB, CSGP, BK, CEC, MOV, KFY, OXPS, SUP, SCHW, BECN, MHP, ITMN, ACTV, MDVN, DISH, SF, TCB, CVC, AMRC, IGTE, PEI, SAPE, ARGN, BGG, ASEI, SLXP, LQDT, CMA, EXP, FOR, CIR, UEIC, DTSI, TLEO, ESC, SIVB, IPAR, KAR, CNW, EXH, JRCC, PKY, WTW, ENS, FOSL, SPR, GTY, DRC, BKD, QUAD, AIMC, DGI, DGIT, TNDM, SYKE, SGNT, AOL, ZOLL and ENOC
Weekly Charts
ETFs
Stocks
*5-Day Change

Stocks Rising into Final Hour on Less Eurozone Debt Angst, Bargain-Hunting, Short-Covering, Lower Energy Prices


Broad Market Tone:

  • Advance/Decline Line: Higher
  • Sector Performance: Most Sectors Rising
  • Volume: Above Average
  • Market Leading Stocks: Outperforming
Equity Investor Angst:
  • VIX 35.25 -9.87%
  • ISE Sentiment Index 124.0 +47.62%
  • Total Put/Call 1.01 -.98%
  • NYSE Arms .85 +185.71%
Credit Investor Angst:
  • North American Investment Grade CDS Index 114.55 -3.78%
  • European Financial Sector CDS Index 209.94 -5.11%
  • Western Europe Sovereign Debt CDS Index 295.17 -1.01%
  • Emerging Market CDS Index 275.25 -6.20%
  • 2-Year Swap Spread 26.0 +2 bps
  • TED Spread 28.0 +1 bp
Economic Gauges:
  • 3-Month T-Bill Yield .01% -1 bp
  • Yield Curve 205.0 -5 bps
  • China Import Iron Ore Spot $175.90/Metric Tonne -.11%
  • Citi US Economic Surprise Index -79.10 -.3 points
  • 10-Year TIPS Spread 2.23% -3 bps
Overseas Futures:
  • Nikkei Futures: Indicating +92 open in Japan
  • DAX Futures: Indicating +7 open in Germany
Portfolio:
  • Higher: On gains in my Biotech, Medical, Retail and Tech sector longs
  • Disclosed Trades: Covered all of my (IWM)/(QQQ) hedges and some of my (EEM) short and then added them back
  • Market Exposure: 75% Net Long
BOTTOM LINE: Today's overall market action is just mildly bullish, as the S&P 500 is well off session highs despite sharp gains in European equities, less eurozone debt angst and recent equity losses. On the positive side, Steel, Computer, Medical Equipment, Biotech and HMO shares are especially strong, rising more than +1.5% on the day. Gold is falling -.63% and oil is down -.33%. European equity indices put in strong showings again today, rising another 3-4%. The France sovereign cds is down -6.46% to 154.50 bps, the Italy sovereign cds is down -2.43% to 359.33 bps, the Germany sovereign cds is dropping -8.49% to 79.42 bps, the UK sovereign cds is dropping -8.44% to 80.25 bps and the Belgium sovereign cds is down -9.06% to 241.0 bps. Moreover, the European Investment Grade CDS Index is down -3.9% to 128.93 bps. On the negative side, Education, Gaming, I-Banking, Bank and Oil Tanker shares are are under pressure, falling more than 1.0%. (XLF) has traded poorly throughout the day. The 10-year yield is dropping -9 bps to 2.25%, despite today's equity rally. Copper is down -.33%, Lumber is down -1.45% and the UBS-Bloomberg Ag Spot Index is up +.33%. Rice is still near a multi-year high, soaring +27.0% in about 6 weeks. The US price for a gallon of gas is falling -.01/gallon today to $3.61/gallon. It is up .47/gallon in about 6 months. The China sovereign cds is rising another +2.13% to 112.0 bps. The China sovereign cds is up +25.13% in 5 days. The China Development Bank Corp. cds has soared +68 bps in 6 days to 230.0 bps. The Asia Pacific Sovereign CDS Index is rising +11.5 bps today to 151.30, which is a new record high. Despite large equity gains in Europe and the US yesterday, Korean stocks fell -1.33% and are down -12.6% ytd. As well, Indian shares fell -1.3% and are now down 17.9% ytd. Russia stocks did not participate in today's rally and are down -9.8% ytd. The large drop in a number of key Eurozone cds is a big positive. However, key emerging market cds continue to rise substantially. It is hard to gauge how much of today's equity rally in Europe was just related to short-covering. Germany must put its entire economy at significant risk to save the euro and it is not clear at all that they are willing to proceed down that path. I expect US stocks to trade mixed-to-lower into the close from current levels on financial sector pessimism, emerging markets inflation fears, profit-taking and more shorting.

Bear Radar


Style Underperformer:

  • Small-Cap Value (+.20%)
Sector Underperformers:
  • 1) Education -4.29% 2) Oil Tankers -2.19% 3) Gaming -2.04%
Stocks Falling on Unusual Volume:
  • TKC, DV, HMY, BBY, BODY, PAA, BYI and DDS
Stocks With Unusual Put Option Activity:
  • 1) MJN 2) FRO 3) IBN 4) ASIA 5) MAKO
Stocks With Most Negative News Mentions:
  • 1) LHO 2) TRH 3) IL 4) USG 5) OEH
Charts:

Bull Radar


Style Outperformer:

  • Mid-Cap Growth (+2.91%)
Sector Outperformers:
  • 1) Steel +2.01% 2) HMOs +1.93% 3) Biotech +1.91%
Stocks Rising on Unusual Volume:
  • REGN, TWTC, E, BTE, SODA, LFUS, RRGB, EXXI, CENX, FFIV, SBRA, LKQX, PANL, AMRN and BGG
Stocks With Unusual Call Option Activity:
  • 1) ROC 2) AVP 3) SYY 4) MNKD 5) RSX
Stocks With Most Positive News Mentions:
  • 1) GOOG 2) NVDA 3) JWN 4) THI 5) ASYS
Charts: