Saturday, March 11, 2006

Market Week in Review

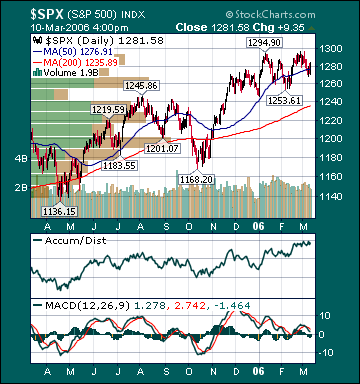
S&P 500 1,281.58 -.44%*

Image hosting by Photobucket

Click here for the Weekly Wrap by Briefing.com.

BOTTOM LINE: Overall, last week's market performance was mildly bearish considering the fall in energy prices, mostly positive economic data and a rise in the US dollar. The advance/decline line fell, most sectors declined and volume was above average on the week. Measures of investor anxiety were mixed. The AAII % Bulls rose slightly to 41.21%, but is still below average levels, which is a positive. The average 30-year mortgage rate rose to 6.37% which is 116 basis points above all-time lows set in June 2003. The benchmark 10-year T-note yield rose 7 basis points on the week as most economic data points were positive and worries over perceived inflation increased. The 10-year yield is still 18 basis points lower than it was in 2004 and 202 basis points below levels at the peak of the bubble in 2000. I expect inflation concerns to peak over the next few weeks and decline through year-end as economic growth slows to average levels, unit labor costs remain subdued and commodity prices weaken further.

Unleaded Gasoline futures fell for the week and have collapsed 41.8% from September highs even as refinery utilization remains below normal as a result of the hurricanes last year, 23.2% of Gulf of Mexico oil production remains shut-in and fears over Iranian/Nigerian production disruptions persist. Natural gas inventories fell less than expected this week. Supplies are now 54.3% above the 5-year average, near an all-time record high for this time of year, even as 14.0% of daily Gulf of Mexico production remains shut-in. Natural gas prices have plunged 57.9% in 12 weeks. Many oil bulls point to the potential for a supply disruption as the main reason oil prices remain extremely elevated while fundamentals for the commodity deteriorate. I would point out that natural gas bulls used the same rationale before the historic supply disruptions related to the hurricanes. This did not prevent a collapse in the price of natural gas. I continue to expect deteriorating fundamentals for oil to trump fear over the intermediate-term, thus sending prices substantially lower. Gold fell for the week as the US dollar rose and energy prices fell. The US dollar gained on continued economic strength relative to other developed nations and rising expectations for more Fed rate hikes.

The CRB Index closed the week convincingly below its 200-day moving average for the first time in almost 5 years. A weekly close below 310 would place the uptrend in commodities that began in 2001 in jeopardy. I expect this to occur over the coming weeks. Weakness in commodity prices led to substantial underperformance by most commodity stocks this week. Technology stocks underperformed, as well, as fears over rising long-term rates sent most high growth stocks lower. The average stock, as measured by the Value Line Geometric Index(VGY), is still up a strong 4.8% so far this year. A 19% rise in this index in less than a year has resulted in the current period of consolidation. While it appears this action could continue a bit longer, I do not expect much more downside in the major averages from current levels. I expect technology, biotechnology, medical, retail, restaurant, gaming, telecom, airline and select financial stocks to provide the leadership for the next push higher in the major averages. The ECRI Weekly Leading Index fell again slightly and is still forecasting healthy, but decelerating, US economic activity.


*5-day % Change

Friday, March 10, 2006

Weekly Scoreboard*

Indices
S&P 500 1,281.58 -.44%
DJIA 11,076.34 +.50%
NASDAQ 2,262.04 -1.76%
Russell 2000 726.34 -1.64%
Wilshire 5000 12,887.10 -.74%
S&P Equity Long/Short Index 1,148.61 -1.16%
S&P Barra Growth 605.92 -.47%
S&P Barra Value 672.16 -.41%
Morgan Stanley Consumer 609.71 +.92%
Morgan Stanley Cyclical 783.77 -.85%
Morgan Stanley Technology 528.45 -2.38%
Transports 4,456.04 -1.18%
Utilities 399.93 -2.90%
S&P 500 Cum A/D Line 8,116 -2.0%
Bloomberg Crude Oil % Bulls 29.5% -15.71%
Put/Call .87 +1.16%
NYSE Arms .75 -13.79%
Volatility(VIX) 11.85 -.92%
ISE Sentiment 156.00 -7.69%
AAII % Bulls 41.21 +.66%
AAII % Bears 30.77 +5.63%
US Dollar 90.85 +1.41%
CRB 319.42 -3.60%
ECRI Weekly Leading Index 136.90 -.22%

Futures Spot Prices
Crude Oil 59.96 -5.72%
Unleaded Gasoline 168.81 -2.87%
Natural Gas 6.65 -2.55%
Heating Oil 168.46 -7.13%
Gold 542.50 -2.57%
Base Metals 164.67 -3.20%
Copper 220.75 +.57%
10-year US Treasury Yield 4.75% +1.5%
Average 30-year Mortgage Rate 6.37% +2.08%

Leading Sectors
REITs +2.96%
Telecom +2.01%
Papers +1.67%
Drugs +1.37%
Gaming +1.33%

Lagging Sectors
Energy -5.02%
Oil Service -6.04%
Alternative Energy -6.27%
Semis -6.59%
Gold & Silver -7.55%

One-Week High-Volume Gainers
One-Week High-Volume Losers

*5-Day % Change

Stocks Modestly Higher into Final Hour as Commodity Shares Rebound

BOTTOM LINE: The Portfolio is slightly lower into the final hour on losses in my Internet longs, Computer longs, Semi longs and Commodity shorts. I added to my (IWM) and (QQQQ) shorts, thus leaving the Portfolio 50% net long. The tone of the market is positive as the advance/decline line is higher, sector performance is positive and volume is about average. The fact that the tech sector was unable to rally today is a negative. I would like to see this important sector participate before becoming more confident that a tradable bottom is in place for the broad market. I expect US stocks to trade mixed into the close from current levels as weakness in the tech sector offsets bargain hunting and short-covering.

***Alert***

I am having trouble posting today due to technical problems with Blogger, the host of this site. Sorry for the inconvenience. I am positioned 75% net long.

Links of Interest

Market Snapshot
Detailed Market Summary
Market Internals
Economic Commentary
Movers & Shakers
Today in IBD
NYSE OrderTrac
I-Watch Sector Overview
NYSE Unusual Volume
NASDAQ Unusual Volume
Hot Spots
NASDAQ 100 Heatmap
DJIA Quick Charts
Chart Toppers
Option Dragon
Real-time Intraday Chart/Quote

Friday Watch

Late-Night Headlines
Bloomberg:
- Microsoft(MSFT) Chairman Bill Gate’s net worth has risen to $50 billion, making him the world’s richest person and widening his lead over No. 2 Warren Buffett, according to Forbes magazine’s annual survey.
- Oil prices may fall further as the end of the winter heating season leads to a decline in fuel consumption, a Bloomberg survey shows.
- China’s producer prices rose in February at the slowest pace in more than two years as the cost of steel fell.

Business Week:
- Eli Lilly(LLY) is likely to boost profit because revenue will rise on its Byetta diabetes drug.

Kyodo Newswire:
- The short-range missiles tested this week by North Korea used upgraded technology that included the use of solid fuel to make transport easier and increase their accuracy.

China Daily:
- SigmaTel Inc.(SGTL), the world’s biggest maker of chips for MP3 players, plans to set up a subsidiary in the southern Chinese city of Shenzhen this month to increase sales.

Korea Herald:
- Kia Motors Corp. is expected to announce plans for its first US plant as early as next week, with a site in southwestern Georgia the leading contender.

Late Buy/Sell Recommendations
Goldman Sachs:
- Reiterated Outperform on (CNO), (STZ), (NFP), (RE), (ENH) and (AIG).
- Reiterated Underperform on (HBAN) and (TWMC).

Night Trading
Asian Indices are -.25% to +.75% on average.
S&P 500 indicated +.02%.
NASDAQ 100 indicated unch.

Morning Preview
US AM Market Call
NASDAQ 100 Pre-Market Indicator/Heat Map
Pre-market Commentary
Before the Bell CNBC Video(bottom right)
Global Commentary
Asian Indices
European Indices
Top 20 Business Stories
In Play
Bond Ticker
Daily Stock Events
Macro Calls
Rasmussen Consumer/Investor Daily Indices
CNBC Guest Schedule

Earnings of Note
Company/EPS Estimate
- (ANN)/.40
- (BOL)/1.20
- (LGN)/-.41
- (NAT)/1.47
- (PHH)/.52
- (SUP)/.22

Upcoming Splits
- (ATLS) 3-for-2
- (MINI) 2-for-1
- (PD) 2-for-1

Economic Releases
8:30 am EST
- The Change in Non-farm Payrolls for February is estimated at 210K versus 193K in January.
- The Unemployment Rate for February is estimated at 4.7% versus 4.7% in January.
- The Change in Manufacturing Payrolls for February is estimated at 5K versus 7K in January.
- Average Hourly Earnings for February are estimated to rise .3% versus a .4% gain in January.

10:00 am EST
- Wholesale Inventories for January are estimated to rise .5% versus a 1.0% increase in December.

2:00 pm EST
- The Monthly Budget Deficit for February is estimated to widen to -$118.3 billion versus -$113.9 billion in January.

BOTTOM LINE: Asian indices are mostly higher, boosted by exporting shares in the region on US dollar strength. I expect US equities to open modestly lower and to rise into the afternoon, finishing mixed. The Portfolio is 25% net long heading into the day.