Click here for the Weekly Wrap by Briefing.com.
BOTTOM LINE: Overall, last week's market performance was bullish. The advance/decline line rose, almost every sector gained and volume was above average on the week. Measures of investor anxiety were mostly lower. The AAII percentage of Bulls rose to 41.33% this week from 38.94% the prior week. This reading is still below above-average levels. The AAII percentage of Bears fell to 38.0% this week from 41.59% the prior week. This reading is still well above average levels. The 10-week moving average of the percentage of Bears is currently 36.1%, an above-average level. The 10-week moving average of the percentage of Bears was 43.0% at the major bear market low during 2002. Moreover, the 50-week moving average of the percentage of Bears is 36.50%, a very high level seen during only two other periods in U.S. history.
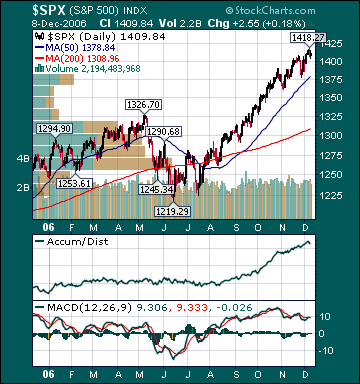
I continue to believe steadfastly high bearish sentiment in many quarters is mind-boggling, considering the S&P 500's 17.7% rise in less than six months, one of the best August/September/October runs in U.S. history, the fact that the Dow made another all-time high today and that we are in the early stages of what is historically a very strong period for U.S. stocks after a mid-term election. Despite recent gains, the forward P/E on the S&P 500 is a very reasonable 16.2 due to the historic run of double-digit profit growth increases, which are poised to continue this quarter. Bears still remain stunningly complacent, in my opinion. As I have said many times over the last few months, every pullback is seen as a major top and every move higher is just another shorting/selling opportunity.
As well, there are many other indicators registering high levels of investor skepticism regarding recent stock market gains. The 50-day moving average of the ISE Sentiment Index just recently crossed above the 200-day moving average for the first time since November 2005. Nasdaq and NYSE short interests are just off record highs. Moreover, public short interest continues to soar to records, and U.S. stock mutual funds have seen outflows for most of the year, according to AMG Data Services. Finally, investment blogger bullish sentiment just hit another new low. There is still a high wall of worry for stocks to climb substantially from current levels as the public remains very skeptical of this bull market.
I continue to believe this is a direct result of the strong belief by the herd that the U.S. is in a long-term trading range or secular bear environment. There is still overwhelming evidence that investment sentiment by the general public regarding U.S. stocks has never been this poor in history, with the Dow registering all-time highs almost weekly. I still expect the herd to finally embrace the current bull market next year, which should result in another meaningful move higher in the major averages as the S&P 500 breaks out to an all-time high to join the Dow and Russell 2000. I continue to believe the coming bullish shift in long-term sentiment with respect to U.S. stocks will result in the "mother of all short-covering rallies."
The average 30-year mortgage rate rose 1 basis point to 6.12%, which is 68 basis points below July highs. I still believe housing is in the process of stabilizing at relatively high levels. Former Fed Chairman Alan Greenspan, current Fed Chairman Ben Bernanke and several current Fed members reiterated there belief recently that the “worst may well be over” for the housing slowdown. Mortgage applications surged 11.4% this week and continue to trend higher with the decline in mortgage rates. This is the second time in less than three months that mortgage applications have seen weekly double-digit percentage gains. The last time this happened was mid-2004. Moreover, the Mortgage Bankers Association said this week that the US housing market will “fully regain its footing” by the middle of 2007.
As well, housing inventories have been trending lower and homebuilding equities have been moving higher. The Housing Index(HGX) has risen 25.4% from July lows. The Case-Schiller housing futures have improved recently and are now projecting a 2.9% decline in the average home price over the next 6 months, up from projections of a 5.2% decline a couple of months ago. Considering the median house has appreciated over 50% during the last few years with record high US home ownership, this would be considered a “soft landing.” The overall negative effects of housing on the US economy and the potential for significant price drops are still being exaggerated by the bears in hopes of dissuading buyers from stepping in, in my opinion. Housing and home equity extractions have been slowing substantially for well over a year and have been mostly offset by many other very positive aspects of the US economy.
Home values are more important than stock prices to the average American, but the median home has barely declined in value after a record run-up, while the S&P 500 has risen 14.8% over the last year and 92.4% since the Oct. 4, 2002 low. Americans’ median net worth is still very close to or at record high levels, a fact that is generally unrecognized or minimized by the record number of market participants that feel it is in their financial and/or political interests to paint a bleak picture of America. Moreover, energy prices are down significantly, consumer spending remains healthy, unemployment is low by historic standards, interest rates are very low, inflation is below average rates, stocks are surging and wages are rising. The economy has created 644,000 jobs in the last four months. Challenger, Gray & Christmas reported recently that November job cuts were 22.7% lower than year-ago levels. As well, the Monster Employment Index hit another record high in November. The unemployment rate is a historically low 4.5%, down from 5.1% in September 2005, notwithstanding fewer real estate-related jobs and significant auto production cutbacks. Retail Sales ex autos for November rose the most since January. Consumer spending is still above long-term average levels and looks poised to remain healthy over the intermediate-term.
The Consumer Price Index for November rose 2.0% year-over-year, down from a 4.7% increase in September of 2005. This is substantially below the long-term average of around 3%. Moreover, the CPI has only been lower during 4 other periods since the mid-1960s. Many other measures of inflation have recently shown substantial deceleration. The Producer Price Index for October matched the largest decline in US history, falling 1.6% year-over-year. Most measures of Americans’ income growth are now more than twice the rate of inflation.
The benchmark 10-year T-note yield rose 4 basis points on the week on stronger economic data and diminishing recession worries. In my opinion, investors’ continuing fears over an economic “hard landing” are still misplaced, notwithstanding recent weak manufacturing data. Moreover, the ISM’s semi-annual forecast was released this week and gave an upbeat assessment expected manufacturing activity next year. The ISM Non-Manufacturing Index, which accounts for the vast majority of U.S. economic growth, rose to a very healthy 58.9 in November. Manufacturing accounts for roughly 12% of US economic growth, while consumer spending accounts for about 70% of growth. U.S. GDP growth came in at 1.1% and 0.7% during the first two quarters of 1995. The ISM Manufacturing Index fell below 50, which signals a contraction in activity, during May 1995. It stayed below 50, reaching a low of 45.5, until August 1996. During that period, the S&P 500 soared 31% as the P/E multiple expanded from 16.0 to 17.2. This was well before the stock market bubble began to inflate. As well, manufacturing was more important to US growth at that time. Stocks can and will rise as P/E multiples expand, even with more average economic and earnings growth. As I have said many times before, P/E multiple expansion is the bears' worst nightmare.
Weekly retail sales rose an above-average 3.2% for the week. Spending is poised to remain strong on lower energy prices, very low long-term interest rates, a rising stock market, healthy job market, decelerating inflation and more optimism. The current conditions component of the December Univ. of Mich. Consumer Confidence Index, which gauges whether or not consumers feel it is a good time to buy big-ticket items, rose to its highest level since March ahead of the holidays.
The CRB Commodities Index, the main source of inflation fears, has declined 4.65% over the last 12 months and is down 14.2% from May highs despite a historic flood of capital into commodity funds and numerous potential upside catalysts. Oil has declined $15/bbl from July highs. The average commodity hedge fund is down substantially for the year. I continue to believe inflation fears have peaked for this cycle as global economic growth stabilizes around average levels, unit labor costs remain subdued and the mania for commodities continues to reverse course.
The EIA reported this week that gasoline supplies fell more than expectations as refinery utilization fell. U.S. gasoline supplies are still at high levels for this time of the year. Gasoline futures fell for the week and have plunged 41.4% from September 2005 highs even as some Gulf of Mexico oil production remains shut-in and fears over future production disruptions persist. Gasoline demand is estimated to rise .8% this year versus a 20-year average of 1.7% demand growth. The still very elevated level of gas prices, related to crude oil production disruption speculation by investment funds, will further dampen global fuel demand, sending gas prices still lower over the intermediate-term.
US oil inventories are still near 7-year highs. Since December 2003, global oil demand is only up .7%, despite booming global growth, while global supplies have increased 6.3%, according to the Energy Intelligence Group. OPEC said recently that crude oil supply would exceed demand by 100 million barrels by the second quarter of next year. Moreover, worldwide oil inventories are poised to begin increasing at an accelerated rate over the next year. I continue to believe oil is priced at extremely elevated levels on fear and record speculation by investment funds, not fundamentals. The Amaranth Advisors hedge fund blow-up is a prime example of the extent to which many investment funds have been speculating on ever higher energy prices through futures contracts, thus driving the price of the underlying commodity to absurd levels. Amaranth, a multi-strategy hedge fund, lost about $6.5 billion of its $9.5 billion under management in less than two months speculating mostly on higher natural gas prices. I continue to believe a number of other funds will experience similar fates over the coming months after managers “press their bets” in hopes of making up for poor performance, which will further pressure energy prices as these funds unwind their leveraged long positions to meet investor redemptions.
Recently, Cambridge Energy Research, one of the most respected energy research firms in the world, put out a report that drills gaping holes in the belief by most investors of imminent "peak oil" production. Cambridge said that its analysis indicates that the remaining global oil base is actually 3.74 trillion barrels, three times greater than "peak oil" theory proponents say and that the "peak oil" theory is based on faulty analysis. I suspect the contango that currently exists in energy futures, which encourages hoarding, will begin to reverse over the coming months as more investors come to the realization that the "peak oil" theory is hugely flawed, global storage fills, and Chinese/US demand slows.
A major top in oil is likely already in place as global crude oil storage capacity utilization is running around 97%. Recent OPEC production cuts will likely result in a complete technical breakdown in crude. Demand destruction is already pervasive globally and will only intensify over the coming years as alternative energy projects come to the fore. Moreover, many Americans feel as though they are helping fund terrorism or hurting the environment every time they fill up their gas tanks. I do not believe we will ever again see the demand for gas-guzzling vehicles that we saw in recent years, even if gas prices plunge from current levels, as I expect. OPEC production cuts, with oil still at very high levels and weakening global growth, only further deepens resentment towards the cartel and will result in even greater long-term demand destruction. Finally, as the fear premium in oil dissipates back to more reasonable levels, global growth slows and supplies continue to rise, crude oil should continue heading meaningfully lower over the intermediate-term, notwithstanding OPEC production cuts. Oil will likely begin another significant downturn before year-end. Finally, I suspect crude will eventually fall to levels that most investors deemed unimaginable just a few months ago during the next significant global economic downturn.
Natural gas inventories fell more than expectations this week. However, prices for the commodity declined as record investment fund speculation continues to subside with supplies now 7.5% above the 5-year average and near all-time high levels for this time of year, even as some daily Gulf of Mexico production remains shut-in. Natural gas prices have collapsed 53.0% since December 2005 highs.
Gold fell again on the week as the US dollar rose. Gold, natural gas and copper all look both fundamentally and technically weak. The US dollar gained on stronger economic data and short-covering. I continue to believe there is very little chance of another Fed rate hike anytime soon. An eventual cut is likely next year as inflation continues to decelerate substantially. A Fed rate cut should actually boost the dollar as currency speculators anticipate faster US growth. Moreover, this month’s net long-term TIC flows report showed foreign investors’ demand for US securities remains very strong.
Paper stocks outperformed for the week on investment bank upgrades. Steel stocks underperformed as fundamentals continue to weaken for the group and buyout speculation subsides. S&P 500 profit growth for the third quarter came in around 20% versus a long-term historical average of 7%, according to Thomson Financial. This marks the 17th straight quarter of double-digit profit growth, the best streak since recording keeping began in 1936. Moreover, another double-digit gain is likely in the fourth quarter. Just a few months ago many investors expected profit growth to fall to the low single digits this year. Despite an 92.4% total return(which is equivalent to a 16.9% average annual return) for the S&P 500 since the October 2002 bottom, its forward p/e has contracted relentlessly and now stands at a very reasonable 16.2. The 20-year average p/e for the S&P 500 is 24.4. The S&P 500 is now up 16.4% and the Russell 2000 Index is up 19.1% year-to-date. Historically, if the S&P 500 is up at least 10% going into the final two months of the year, which it was, it continues to climb the last two months 84% of the time.
Current stock prices are still providing longer-term investors very attractive opportunities, in my opinion. In my entire investment career, I have never seen the best “growth” companies in the world priced as cheaply as they are now relative to the broad market. By contrast, “value” stocks are quite expensive in many cases. A CSFB report earlier this year confirmed this view. The report concluded that on a price-to-cash flow basis growth stocks are cheaper than value stocks for the first time since at least 1977. The entire decline in the S&P 500’s p/e, since the bubble burst in 2000, is attributable to growth stock multiple contraction. I still expect the most overvalued economically sensitive and emerging market stocks to continue underperforming over the intermediate-term as the manias for those shares subside and global growth slows to more average rates. I continue to believe a chain reaction of events has begun that will result in a substantial increase in demand for US stocks.
In my opinion, the market is still factoring in way too much bad news at current levels, notwithstanding recent gains. One of the characteristics of the current “negativity bubble” is that most potential positives are undermined, downplayed or completely ignored, while almost every potential negative is exaggerated, trumpeted and promptly priced in to stock prices. Furthermore, this “irrational pessimism” by investors has resulted in a dramatic decrease in the supply of stock this year as companies bought back shares, IPOs were pulled and secondary stock offerings canceled. Booming merger and acquisition activity is also greatly constricting the supply of stock. Many commodity funds, which have received huge capital infusions this year, will likely see significant outflows at year-end. Some of this capital will likely find its way back to US stocks. As well, money market funds are brimming with cash. I continue to believe there is massive bull firepower available on the sidelines for US equities at a time when the supply of stock has contracted.
Rising optimism for a Fed rate cut, a stronger US dollar, lower commodity prices, seasonal strength, decelerating inflation readings, a strong holiday shopping season, lower long-term rates, increased consumer/investor confidence, short-covering, investment manager performance anxiety, rising demand for US stocks and the realization that economic growth is only slowing to around average levels should provide the catalysts for another substantial push higher in the major averages over the intermediate-term as p/e multiples expand further. The S&P 500 has now met my early year prediction of a 15% total return for the year. However, further gains are possible through year-end even as the bears and many bulls continue to position for an imminent pullback after recent sharp gains. Another strong performance by US equities is likely next year. Finally, the ECRI Weekly Leading Index surged this week to new cycle highs and is forecasting a modest acceleration in US economic activity.
*5-day % Change
No comments:
Post a Comment