Saturday, January 05, 2008

Market Week in Review

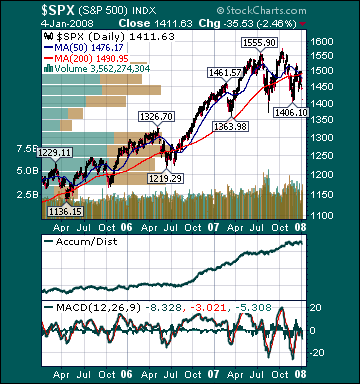
S&P 500 1,411.63 -4.39%*

Photobucket

Click here for the Weekly Wrap by Briefing.com.

Friday, January 04, 2008

Weekly Scoreboard*

Indices
S&P 500 1,411.63 -4.39%
DJIA 12,800.18 -4.19%
NASDAQ 2,504.65 -6.43%
Russell 2000 721.60 -6.71%
Wilshire 5000 14,154.51 -4.56%
Russell 1000 Growth 585.92 -4.87%
Russell 1000 Value 767.30 -3.98%
Morgan Stanley Consumer 712.75 -4.07%
Morgan Stanley Cyclical 939.56 -6.03%
Morgan Stanley Technology 583.50 -7.20%
Transports 4,260.39 -7.78%
Utilities 532.08 -.17%
MSCI Emerging Markets 147.41 -3.36%

Sentiment/Internals
NYSE Cumulative A/D Line 59,948 -3.63%
Bloomberg New Highs-Lows Index -545
Bloomberg Crude Oil % Bulls 52.0 +26.8%
CFTC Oil Large Speculative Longs 238,361 +8.65%
Total Put/Call +1.12 +16.7%
NYSE Arms 4.33 +93.3%
Volatility(VIX) 23.94 +18.16%
ISE Sentiment 93.0 -23.8%
AAII % Bulls 25.7 -14.3%
AAII % Bears 55.2 +10.5%

Futures Spot Prices
Crude Oil 97.69 +.96%
Reformulated Gasoline 251.0 -.73%
Natural Gas 7.84 +9.48%
Heating Oil 268.35 +.17%
Gold 862.50 +4.1%
Base Metals 225.79 +5.2%
Copper 313.30 +1.0%

Economy
10-year US Treasury Yield 3.87% -21 basis points
4-Wk MA of Jobless Claims 343,800 -.2%
Average 30-year Mortgage Rate 6.07% -10 basis points
Weekly Mortgage Applications 533,900 -11.6%
Weekly Retail Sales +1.4%
Nationwide Gas $3.07/gallon +.03/gallon
US Heating Demand Next 7 Days 33.0% below normal
ECRI Weekly Leading Economic Index 135.10 +.07%
US Dollar Index 75.92 -1.06%
CRB Index 366.22 +1.79%

Best Performing Style
Large-cap Value -3.98%

Worst Performing Style
Small-cap Value -7.06%

Leading Sectors
Utilities -.17%
HMOs -.65%
Oil Service -1.57%
Construction -1.58%
Foods -1.91%

Lagging Sectors
Retail -9.17%
Semis -9.36%
Computer Hardware -9.94%
Airlines -10.62%
Homebuilders -10.94%

One-Week High-Volume Gainers

One-Week High-Volume Losers

*5-Day Change

Stocks Sharply Lower into Final Hour on Spike in Economic Pessimism, Profit-taking

BOTTOM LINE: The Portfolio is lower into the final hour on losses in my Semi longs, Computer longs, Retail longs and Medical longs. I added to my (SIGM) long and took some profits in my (TLT) long today, thus leaving the Portfolio 75% net long. The overall tone of the market is very negative today as the advance/decline line is substantially lower, every sector is declining and volume is above average. Investor anxiety is very elevated. Today’s overall market action is bearish. Trading this afternoon has taken on a panicky tone, which is usually indicative of at the very least a tradable bottom. The total put/call hit a high 1.42 again this morning and the ISE Sentiment Index hit a depressed 80.0. For the seventh day in a row, the NYSE Arms is high, hitting a very elevated 3.68. The VIX is surging 7% to a high 24.1. Today’s biggest losers are last year’s biggest winners. This is creating an excellent buying opportunity in many true growth stocks. I still expect large buyers to emerge next week. The 10-year swap spread is falling substantially to 61.36 basis points over Treasuries today, down from a peak of 87.50 in November, as credit market anxiety continues to diminish. I expect US stocks to trade higher into the close from current levels on short-covering and bargain-hunting.

Bearish Sentiment Still Exceeds Levels Seen at Lows of 2000-2003 Bear Market

* Notwithstanding historical individual investor pessimism, corporate insiders continue to buy their own stocks.

The AAII percentage of bulls dropped to 25.71% this week from 30.0% the prior week. This reading remains at depressed levels. The AAII percentage of bears rose to 55.24% this week from 50.0% the prior week. This reading remains at an elevated level. Moreover, the 10-week moving average of the percentage of bears is currently at 47.4%, a very elevated level. It has only been higher one other period in its history, which was September 1990-December 1990. Moreover, the 10-week moving average of the percentage of bears peaked at 43.0% right near the major bear market low during 2002. It is astonishing that the 10-week moving average of the % bears is currently greater than at any time during the bubble bursting meltdown of 2000-2003, which was arguably the worst stock market decline since the Great Depression.

Furthermore, the 50-week moving average of the percentage of bears is currently 39.1%, also a very elevated level seen during only one other period since tracking began in the 80s. That period was October 1990-July 1991, right near another major stock market bottom. The extreme reading of the 50-week moving average of the percentage of bears during that period peaked at 41.6% on Jan. 31, 1991. The current reading of 39.1% is above the peak during the 2000-2003 bear market, which was 38.1% on April 10, 2003. I find this even more astonishing, notwithstanding the recent pullback, given that the S&P 500 is currently 96.9% higher from the October 2002 major bear market lows and 8.6% off its recent record high.

Individual investor pessimism towards US stocks is currently deep-seated and historical in nature. This is just more evidence of the current “US negativity bubble.” It is also noteworthy that as investor pessimism grows ever thicker, corporate insiders continue to display downright giddy behavior with their recent stock activity during this pullback. It is even more interesting that the retail sector is seeing substantial insider buying, notwithstanding the current extreme investor pessimism towards the prospects for consumer spending. Prior to the 2000 economic downturn, insiders were bailing in droves. I still expect US stocks to turn in a positive return for this quarter as the undying belief in an imminent recession begins to fade and the uncertainty currently surrounding the financial sector lifts substantially.

Fewer Jobs Created Than Expected, Unemployment Rises, Average Hourly Earnings Very Healthy, ISM Non-Manufacturing Better Than Estimates

- The Change in Non-farm Payrolls for December was 18K versus estimates of 70K and an upwardly revised 115K in November.

- The Unemployment Rate in December rose to 5.0% versus estimates of 4.8% and a reading of 4.7% in November.

- Average Hourly Earnings for November rose .4% versus estimates of a .3% increase and a .4% gain in November.

- ISM Non-Manufacturing for December fell to 53.9 versus estimates of 53.5 and a reading of 54.1 in November.

BOTTOM LINE: Hiring in the US slowed more than forecast in December and unemployment rose to the highest level since 2006, Bloomberg reported. Service industries, which includes banks, insurance companies and restaurants, added 93,000 workers last month. Builders reduced payrolls by 49,000 versus a 37,000 decline in November. Unemployment, while rising, is still historically low. The average unemployment rate over the last 50 years is 5.9%. Moreover, non-farm payrolls are quite volatile and a 3-month average is more appropriate to gauge the health of the job market. Non-farm payrolls have seen average gains of 97,330 over the last three months, which isn’t too bad. Average Hourly Earnings are rising at a 3.7% rate year-over-year, which is very good by historic standards. The 12-month moving average of average hourly earnings is currently rising at a 3.9% rate year-over-year. The only period during the entire 90s expansion that saw a greater increase in Americans' hourly earnings was early 98-early 99. This has helped contribute to the all-time high in Americans’ net worth that was reached again last quarter. A calming of the credit markets should lead to better economic data later this quarter. It appears to me that investors are once again pricing in the worst case scenario and are overreacting to today’s data. Fed fund futures now imply a 54.0% chance for a 50 basis point rate cut at the upcoming Fed meeting, up from 34.0% yesterday and 0% one week ago. The odds of a recession beginning this year have barely budged today, according to Intrade.com. The 10-year yield is only 3 basis points lower on today's news. Current gauges of investor angst indicate we are very close to another meaningful bottom in US stocks. I expect non-farm payrolls to rise more next month and the unemployment rate to tick slightly lower.

US service industries expanded in December slightly more than economists expected, Bloomberg reported. The new orders component of the index rose to 53.5 versus 51.1 the prior month. The Employment Component of the index rose to 53.5 from 51.1 the prior month. The Inventories component was unchanged at 50.5. The Prices Paid component fell to 72.5 from 76.5 the prior month. This gauge of the health of the largest part of the US economy is still indicating expansion. I still expect US 4Q GDP growth of around 1% and growth to average around 2% for all of this year. I expect the ISM Non-Manufacturing Index to rise next month.

Bull Radar

Style Outperformer:

Large-cap Value(-1.0%)

Sector Outperformers:

HMOs (-.11%), Telecom (-.45%) and Drugs (-.48%)

Stocks Rising on Unusual Volume:
AHD, PZE, AZZ, JTX, PNM, OSIR, AKNS, SONC, OSIP, CRXL, HGSI, SHLM, PPDI, ITMN, DWSN, CREE, RJET, GENZ and KPN