Portfolio Manager's Commentary on Investing and Trading in the U.S. Financial Markets
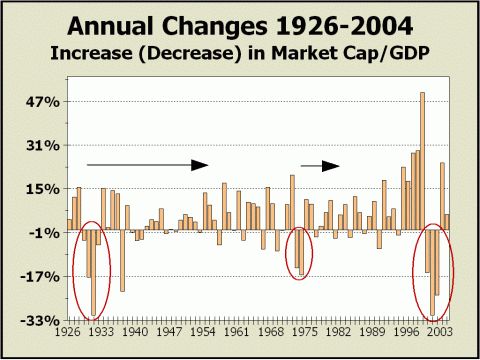
Bottom Line: The above chart illustrates the magnitude of the stock market collapse that began in early 2000 and ended in 2002. This is one of the many reasons that investors have been "irrationally pessimistic" this year.
Post a Comment
No comments:
Post a Comment