Click here for the Weekly Wrap by Briefing.com.
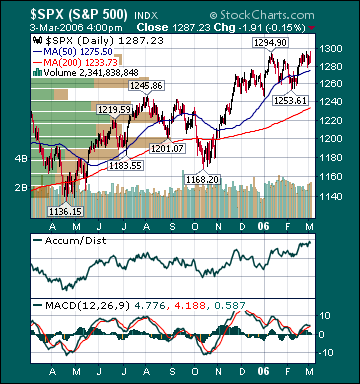
BOTTOM LINE: Overall, last week's market performance was slightly bullish considering the rise in long-term rates, weaker housing data and increase in oil prices. The advance/decline line fell slightly, most sectors rose and volume was above average on the week. Measures of investor anxiety were mostly higher. The AAII % Bulls fell to 40.94% and is now below average levels, which is a positive. The average 30-year mortgage rate fell to 6.24% which is only 103 basis points above all-time lows set in June 2003. The benchmark 10-year T-note yield rose 11 basis points on the week as most economic data points were positive. However, the yield is still 25 basis points lower than it was in 2004 and 209 basis points below levels at the peak of the bubble in 2000.
Unleaded Gasoline futures bounced again for the week, but have collapsed 40% from September highs even as refinery utilization remains below normal as a result of the hurricanes last year, 24.2% of Gulf of Mexico oil production remains shut-in and fears over Iranian/Nigerian production disruptions persist. Natural gas inventories fell slightly more than expected this week. However, supplies are now 48.2% above the 5-year average, approaching an all-time record high for this time of year, even as 15.2% of daily Gulf of Mexico production remains shut-in. Natural gas prices have plunged 57% in 11 weeks. Many oil bulls point to the potential for a supply disruption as the main reason oil prices remain extremely elevated while fundamentals for the commodity deteriorate. I would point out that natural gas bulls used the same rationale before the historic supply disruptions related to the hurricanes. This did not prevent a collapse in the price of natural gas. I expect deteriorating fundamentals for oil to trump fear over the intermediate-term, thus sending prices substantially lower. Gold rose modestly for the week as the US dollar weakened and energy prices rose. The dollar’s decline was mainly the result of hawkish comments from central bankers in Asia and Europe.
Small-caps continue to outperform as the Russell 2000 has already gained almost 10% for the year. Moreover, technology stocks outperformed for the week, led by Networking shares on more evidence of increased spending by telecom companies. S&P 500 earnings growth for the fourth quarter was up about 15.0% year-over-year, more than double the long-term average. This is the 15th consecutive quarter of double-digit profit growth, the best streak since record-keeping began in 1936. Moreover, companies have sufficiently lowered the bar as to allow for better-than-expected 1Q results. As of now, analysts are projecting 9.8% earnings growth for the first quarter, still very good by historic standards. I continue to believe the S&P 500’s forward p/e multiple will expand back to around 19 by year-end, thus helping to push the index about 15% higher for the year. The average stock, as measured by the Value Line Geometric Index, is already up 6.2% this year. The ECRI Weekly Leading Index fell slightly, but is still forecasting healthy, but decelerating, US economic activity. I expect US GDP growth to peak for the year this quarter, rising a brisk 4-4.5%. Growth should moderate to more average levels of around 3% the remainder of the year.
*5-day % Change
No comments:
Post a Comment