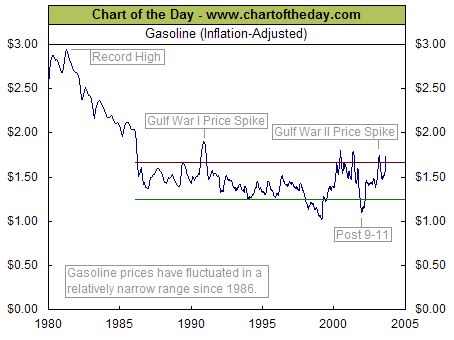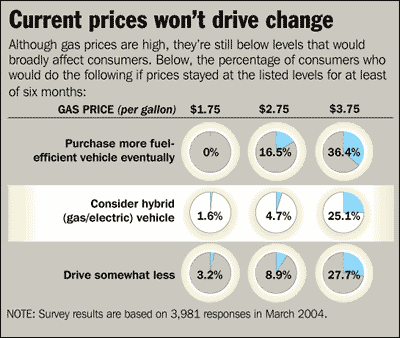

Bottom Line: As the top chart illustrates, gasoline prices on an inflation-adjusted basis are at the upper end of the trading range they have been in since 1986. Gas prices would have to soar another 70% to reach levels seen during the late 70's/early 80's. As well, the survey illustrated in the bottom chart seems to point to an overstatement by the media and some companies of the effects of gas prices on consumers at current levels.
No comments:
Post a Comment