Sunday, June 26, 2005

Weekly Outlook

There are a few important economic reports and several significant corporate earnings reports scheduled for release this week.

Economic reports for the week include:

Mon. - None of note
Tues. - Consumer Confidence
Wed. - Final 1Q GDP, Final 1Q Personal Consumption, Final 1Q GDP Price Index
Thur. - Personal Income, Personal Spending, PCE Deflator, Initial Jobless Claims, Chicago Purchasing Manager, Help Wanted, FOMC Rate Decision
Fri. - Univ. of Mich. Consumer Confidence

Some of the more noteworthy companies that release quarterly earnings this week are:

Mon. - Cyberonics Inc.(CYBX), Nike Inc.(NKE), Walgreen Co.(WAG), Paychex Inc.(PAYX), Sonic Corp.(SONC)
Tues. - Apollo Group(APOL), BearingPoint(BE), BMC Software(BMC), Doral Financial(DRL), Emmis Communications(EMMS)
Wed. - General Mills(GIS), Monsanto(MON), Oracle Corp.(ORCL)
Thur. - American Greetings(AM), Biomet(BMET), ConAgra Foods(CAG), Constellation Brands(STZ), PalmOne(PLMO), Red Hat(RHAT)
Fri. - None of note

Other events that have market-moving potential this week include:

Mon. - Wachovia Equity Conference
Tue. - Banc of America Utilities & Gas Conference, Wachovia Equity Conference, Bear Stearns Biotech Conference
Wed. - Morgan Stanley Business and Professional Conference, Wachovia Equity Conference
Thur. - Wachovia Equity Conference, Morgan Stanley Business and Professional Conference
Fri. - F, DCX, GM Sales Conference Call

BOTTOM LINE: I expect US stocks to finish the week modestly higher. End-of-the-quarter window dressing, an end to Fed speculation and better economic data should spur stock gains next week. A reversal in oil would obviously help, as well. US stocks will likely remain mixed over the next few weeks as earnings pre-announcements come in. A stronger dollar and weakening economic conditions in Europe may adversely affect US companies with significant exposure to the region. While the current level of energy prices is having minimal direct impact on US consumer spending thus far, it is affecting the already weakened economies of other nations to a much greater degree. With China's economy becoming increasingly susceptible to a "hard-landing" and Europe on the verge of negative growth, the odds of a synchronized global slowdown are rising. I continue to believe energy prices will decline precipitously during the second half of the year as global demand slows more than most anticipate. This should have a very positive effect on US stock prices. As well, low interest rates, lower inflation, a modestly improving labor market, a flight to US assets, a strong but slowing housing market, reasonable valuations and a stable dollar should help boost equities during this time period. My trading indicators are now giving neutral signals and the Portfolio is 75% net long heading into the week.
Saturday, June 25, 2005

Economic Week in Review

ECRI Weekly Leading Index 133.40 -.52%

Leading Indicators for May fell .5% versus estimates of a .3% decrease and an unchanged reading in April. The index of leading economic indicators fell for the fourth month in five, pulled down by a flattening of the yield curve. The University of Michigan’s Consumer Confidence Index fell in May which also contributed to the overall decline, however it has since rebounded. The Conference Board has stated that they believe a six-moth annualized decline of 3.5% or more would suggest imminent risk of recession. However, the six-moth annualized decline in May was 2.2%. "This is the fifth consecutive month of flat or down LEI numbers and this last happened ahead of the 1995 soft landing," said David Rosenberg, Chief North American Economist at Merrill Lynch. "The June LEI will rise, thanks to higher stock prices and consumer sentiment," said Ian Sheperdson, chief US economist at High Frequency Economics.

Initial Jobless Claims for last week fell to 314K versus estimates of 330K and 334K the prior week. Continuing Claims fell to 2600K versus estimates of 2600K and 2638K prior. The number of US workers filing first-time claims for jobless benefits fell more than expected as companies retained more of the productive workers who have led the economic recovery. The four-week moving average, a less volatile measure, fell 2,500 to 333,000, Bloomberg reported. "Growth is picking up, business conditions are improving and fewer companies are looking to trim staff at this point in the recovery," said Wesley Beal, chief US economist at IDEAglobal.com. "This report signals there's a good chance we'll see stronger employment growth in June." The four-week moving average of continuing claims fell to 2.603M from 2.596M, Bloomberg reported. "In the second half of an expansion, companies typically hold on to workers more closely as productivity gains slow and the pool of unemployed workers diminishes," said Michael Englund, chief economist at Action Economics. The insured unemployment rate, which tracks closely with the US unemployment rate, fell to 2.0% from 2.1% the week before last.

Existing Home Sales for May fell to 7.13M versus estimates of 7.15M and 7.18M in April. US sales of previously owned homes fell in May to the second-highest level on record, as low borrowing costs and rising incomes fueled demand and pushed prices to an all-time high, Bloomberg said. The median home sales price increased to $207,000 from $205,000 and is up 12.5% over the last 12 months. The supply of homes available for sale, another gauge of housing demand, rose to 4.3 months' worth in May from 4.1 months' worth the previous month, Bloomberg reported. "There clearly is some froth in some markets but we still don't see a nationwide housing bubble," said Fed Governor Olson.

Durable Goods Orders for May rose 5.5% versus estimates of a 1.5% increase and a 1.4% gain in April. Durables Ex Transportation for May fell .2% versus estimates of a .5% increase and a .7% decline in April. Orders for durable goods rose in May by the most in more than a year, mainly reflecting a surge in bookings for Boeing aircraft. With inventories fairly high and fuel costs rising, investment in new equipment may be slow to recover in coming months, Bloomberg said. At the current sales pace, manufacturers have 1.41 months of supply, unchanged from a month earlier and near a two-year high. Transportation equipment orders surged 21.2%, the most since July 2002, after rising 7.8% in April. Orders for non-defense capital goods excluding aircraft, a gauge of future business investment, fell 2.3% last month. However, unfilled orders, a proxy of future production rose 1.9%, the most since June 2000.

New Home Sales for May rose to 1298K versus estimates of 1320K and a downwardly revised 1271K in April. US new home sales rose to the second-best level in history, boosted by low mortgage rates and an improving job market. Prices declined 6.6%, the most since January 2003. The median price of a new home fell to $217,000 from $232,200 in April. The median price of a new home has increased 2.5% over the last 12 months. The National Association of Realtors said this year would be a record year for sales of both new and existing homes, beating last year’s records. Sales rose 22.9% in the Midwest and fell 24.5% in the Northeast. The supply of homes for sale was unchanged at 4.2 months in May, a relatively low level.

BOTTOM LINE: Overall, last week's economic data were modestly positive. The Leading Indicators is not as useful as other gauges, however it should not be ignored. At this point, it continues to forecast slowing growth, but not a recession. The labor market continues to improve at a moderate, choppy pace. This should hold unit labor costs in check. This month's payroll report should improve modestly over last month's. Home price appreciation appears to be moderating to more sustainable healthy rates. I continue to believe prices will consolidate at elevated levels for a few years rather than decline precipitously. Manufacturing activity is still sluggish and will likely remain that way for several more months. Finally, the ECRI Weekly Leading Index fell .52% to 133.40 and is forecasting moderately decelerating growth.

Market Week in Review

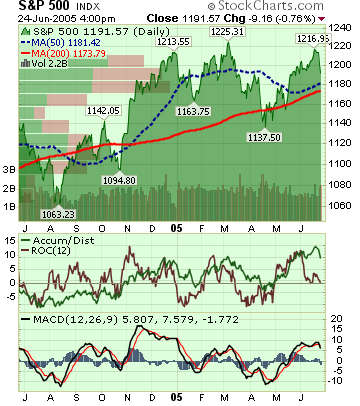
S&P 500 1,191.57 -2.09%*

Image hosted by Photobucket.com

Click here for the Weekly Wrap by Briefing.com.

BOTTOM LINE: Overall, last week's market performance was negative. The advance/decline line fell, almost every sector declined and volume was average on the week. Measures of investor anxiety were mostly higher. The AAII % Bulls fell and is around average levels. Mortgage rates declined and are now 36 basis points away from all-time lows set in June 2003. The benchmark 10-year T-note yield broke back below 4% and appears poised to test the lows of 3.77% last seen in March 2004. Cyclicals underperformed substantially as worries over slowing global growth resurfaced. As well, high energy prices and a stronger US dollar added to earnings jitters. I expect the dollar index to break up through resistance at 90.0 over the coming weeks. Energy prices were mostly unchanged even as evidence continues to mount of a significant slowing in global demand. A report on Friday showed China imported 2.45 million barrels of crude oil per day last month, down 18.3% from April and only equal to the average for all of 2004. As of last month, global supply was 85.0M barrels per day and global demand was 82.1M barrels per day. This is the widest gap since May 1998. Steel stocks led all decliners on worries over substantial excess capacity coming from Asia and slowing global demand. Investors took profits in the Homebuilders as home price appreciation appears to have stabilized. On the positive side, I-Banks outperformed substantially for the week on positive news from Morgan Stanley and Legg Mason. As well, Technology shares held recent gains for the most part, led by Semiconductor stocks.

Friday, June 24, 2005

Weekly Scoreboard*

Indices
S&P 500 1,191.57 -2.09%
DJIA 10,297.84 -3.06%
NASDAQ 2,053.27 -1.76%
Russell 2000 630.41 -2.14%
DJ Wilshire 5000 11,829.64 -1.97%
S&P Equity Long/Short Index 1,027.10 +.35%
S&P Barra Growth 567.94 -2.61%
S&P Barra Value 619.57 -1.57%
Morgan Stanley Consumer 570.50 -2.43%
Morgan Stanley Cyclical 712.27 -4.24%
Morgan Stanley Technology 476.40 -1.16%
Transports 3,411.24 -5.03%
Utilities 380.68 +.79%
S&P 500 Cum A/D Line 7,570.00 -3.55%
Bloomberg Crude Oil % Bulls 48.0% -6.74%
Put/Call .89 -13.59%
NYSE Arms 1.39 +78.21%
Volatility(VIX) 12.18 +6.10%
ISE Sentiment 247.00 +130.84%
AAII % Bulls 46.59 -3.04%
US Dollar 88.78 +1.28%
CRB 312.24 +.41%

Futures Spot Prices
Crude Oil 59.84 +1.08%
Unleaded Gasoline 165.57 +.53%
Natural Gas 7.36 -4.42%
Heating Oil 165.04 -.34%
Gold 442.00 +.43%
Base Metals 124.30 -2.30%
Copper 155.05 -.16%
10-year US Treasury Yield 3.92% -3.76%
Average 30-year Mortgage Rate 5.57% -1.07%

Leading Sectors
I-Banks +4.04%
Alternative Energy +.21%
HMOs -.27%

Lagging Sectors
Disk Drives -4.45%
Homebuilders -5.04%
Steel -12.38%

*5-Day % Change

Stocks Lower Mid-day on Earnings Worries

Indices
S&P 500 1,194.92 -.48%
DJIA 10,329.29 -.88%
NASDAQ 2,057.31 -.64%
Russell 2000 627.12 -1.10%
DJ Wilshire 5000 11,852.58 -.54%
S&P Barra Growth 569.79 -.58%
S&P Barra Value 620.94 -.40%
Morgan Stanley Consumer 572.37 -.60%
Morgan Stanley Cyclical 711.89 -1.42%
Morgan Stanley Technology 477.21 -1.01%
Transports 3,410.27 -1.36%
Utilities 381.87 -.40%
Put/Call .89 +18.67%
NYSE Arms 1.53 +32.80%
Volatility(VIX) 12.07 -.49%
ISE Sentiment 226.00 +43.04%
US Dollar 88.80 -.36%
CRB 311.97 +.17%

Futures Spot Prices
Crude Oil 59.80 +.64%
Unleaded Gasoline 165.70 +.02%
Natural Gas 7.37 -1.31%
Heating Oil 166.15 -.84%
Gold 442.00 unch.
Base Metals 124.30 +.95%
Copper 154.45 -.39%
10-year US Treasury Yield 3.92% -.73%

Leading Sectors
I-Banks +1.66%
Gold & Silver +.71%
Biotech +.33%

Lagging Sectors
Networking -2.07%
Steel -2.29%
Airlines -3.51%
BOTTOM LINE: The Portfolio is unchanged mid-day as gains in my Internet longs, Steel shorts and Oil Tanker shorts are offsetting losses in my Homebuilding and Retail longs. I have not traded today, thus leaving the Portfolio 50% net long. The tone of the market is negative as the advance/decline line is substantially lower, almost every sector is lower and volume is very light. Measures of investor anxiety are mixed. Today’s overall market action is negative. China's Iron and Steel Association said last night that China may use 300 million tons of steel this year and produce 322 million tons, citing the National Development and Reform Commission. This is the first time the country's top planning body has indicated demand will fall short of supply. Earlier in the week the vice chairman of the China Iron and Steel Association said 90% of the country's steel producers will be unprofitable soon. Look for the Chinese government to try and cap production soon. This should further curtail China's energy demand. I expect US stocks to trade mixed-to-higher into the close on short-covering.