Monday, May 28, 2012

Tuesday Watch


Night Trading

  • Asian equity indices are -.25% to +.75% on average.
  • Asia Ex-Japan Investment Grade CDS Index 194.75 -5.0 basis points.
  • Asia Pacific Sovereign CDS Index 160.75 -3.5 basis points.
  • FTSE-100 futures +.19%.
  • S&P 500 futures +.74%.
  • NASDAQ 100 futures +.81%.
Morning Preview Links

Earnings of Note
Company/Estimate
  • (CPRT)/.43
  • (SAFM)/.90
Economic Releases
9:00 am EST
  • The S&P/Case-Shiller US Home Price Composite-20 YoY for March is estimated to fall -2.55% versus a -3.49% decline in February.
  • The S&P/CS US Home Price Index YoY for 1Q is estimated to fall -3.05% versus a -4.03% decline in 4Q.

10:00 am EST

  • Consumer Confidence for May is estimated to rise to 69.5 versus 69.2 in April.

10:30 am EST

  • Dallas Fed Manufacturing Activity for May is estimated to rise to 1.5 versus -3.4 in April.

Upcoming Splits

  • None of note

Other Potential Market Movers

  • The Italy T-Bill auction, weekly retail sales reports, KeyBanc Industrial/Automotive Conference and the BofA Merrill Telecom/Media Conference could also impact trading today.
BOTTOM LINE: Asian indices are mostly higher, boosted by technology and commodity shares in the region. I expect US stocks to open modestly higher and to weaken into the afternoon, finishing mixed. The Portfolio is 75% net long heading into the day.

Weekly Outlook


Wall St. Week Ahead by Reuters.
Stocks to Watch Tuesday by MarketWatch.
Weekly Economic Calendar by Briefing.com.

BOTTOM LINE: I expect US stocks to finish the week mixed as rising global growth fears, less US economic optimism, rising Eurozone debt angst and high energy prices offset short-covering, technical buying and bargain-hunting. My intermediate-term trading indicators are giving mostly bearish signals and the Portfolio is 75% net long heading into the week.

Sunday, May 27, 2012

Market Week in Review


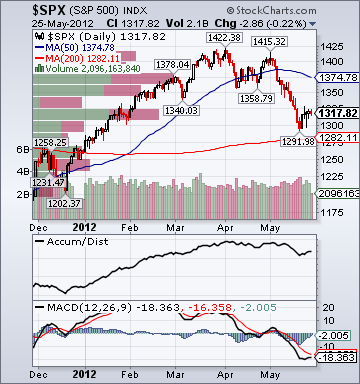
S&P 500 1,317.82 +1.75%*

Photobucket

The Weekly Wrap by Briefing.com.

*5-Day Change

Weekly Scoreboard*


Indices

  • S&P 500 1,317.82 +1.75%
  • DJIA 12,454.83 +.69%
  • NASDAQ 2,837.53 +2.11%
  • Russell 2000 766.41 +2.57%
  • Value Line Geometric(broad market) 337.48 +2.37%
  • Russell 1000 Growth 623.29 +2.24%
  • Russell 1000 Value 644.27 +1.58%
  • Morgan Stanley Consumer 776.22 +1.31%
  • Morgan Stanley Cyclical 912.02 +3.56%
  • Morgan Stanley Technology 634.64 +.45%
  • Transports 5,079.84 +4.23%
  • Utilities 467.35 +.69%
  • Bloomberg European Bank/Financial Services 68.35 +2.35%
  • MSCI Emerging Markets 37.56 -.26%
  • Lyxor L/S Equity Long Bias 997.88 -.63%
  • Lyxor L/S Equity Variable Bias 804.93 -.81%
  • Lyxor L/S Equity Short Bias 539.20 unch.
Sentiment/Internals
  • NYSE Cumulative A/D Line 137,902 +2.62%
  • Bloomberg New Highs-Lows Index -241 +287
  • Bloomberg Crude Oil % Bulls 27.0 +3.9%
  • CFTC Oil Net Speculative Position 184,071 -.21%
  • CFTC Oil Total Open Interest 1,442,523 -6.28%
  • Total Put/Call 1.09 -19.85%
  • OEX Put/Call .84 -22.94%
  • ISE Sentiment 102.0 -13.56%
  • NYSE Arms .90 +15.38%
  • Volatility(VIX) 21.76 -13.31%
  • S&P 500 Implied Correlation 68.52 -5.57%
  • G7 Currency Volatility (VXY) 11.16 -1.85%
  • Smart Money Flow Index 10,910.03 +1.45%
  • Money Mkt Mutual Fund Assets $2.565 Trillion +.10%
  • AAII % Bulls 30.5 +29.2%
  • AAII % Bears 38.6 -15.9%
Futures Spot Prices
  • CRB Index 281.95 -2.92%
  • Crude Oil 90.86 -.86%
  • Reformulated Gasoline 289.29 +.10%
  • Natural Gas 2.57 -5.76%
  • Heating Oil 282.88 -.28%
  • Gold 1,571.20 -1.43%
  • Bloomberg Base Metals Index 202.82 -1.14%
  • Copper 344.80 +.03%
  • US No. 1 Heavy Melt Scrap Steel 395.0 USD/Ton +.25%
  • China Iron Ore Spot 130.50 USD/Ton -.61%
  • Lumber 289.20 +1.22%
  • UBS-Bloomberg Agriculture 1,434.55 -2.49%
Economy
  • ECRI Weekly Leading Economic Index Growth Rate .40% unch.
  • Philly Fed ADS Real-Time Business Conditions Index .2003 -5.79%
  • S&P 500 Blended Forward 12 Months Mean EPS Estimate 110.89 +.07%
  • Citi US Economic Surprise Index -24.50 +.6 point
  • Fed Fund Futures imply 64.0% chance of no change, 36.0% chance of 25 basis point cut on 6/20
  • US Dollar Index 82.40 +1.62%
  • Yield Curve 145.0 +2 basis points
  • 10-Year US Treasury Yield 1.74% +2 basis points
  • Federal Reserve's Balance Sheet $2.843 Trillion +.31%
  • U.S. Sovereign Debt Credit Default Swap 47.50 +6.74%
  • Illinois Municipal Debt Credit Default Swap 239.0 +.82%
  • Western Europe Sovereign Debt Credit Default Swap Index 316.55 +1.46%
  • Emerging Markets Sovereign Debt CDS Index 323.12 +.93%
  • Saudi Sovereign Debt Credit Default Swap 132.14 +1.90%
  • Iraq Sovereign Debt Credit Default Swap 444.42 +1.58%
  • China Blended Corporate Spread Index 635.0 -6 basis points
  • 10-Year TIPS Spread 2.14% unch.
  • TED Spread 38.5 -.5 basis point
  • 2-Year Swap Spread 35.25 -1.25 basis points
  • 3-Month EUR/USD Cross-Currency Basis Swap -47.75 -4.75 basis points
  • N. America Investment Grade Credit Default Swap Index 117.29 -3.35%
  • Euro Financial Sector Credit Default Swap Index 295.90 -4.05%
  • Emerging Markets Credit Default Swap Index 320.28 +2.06%
  • CMBS Super Senior AAA 10-Year Treasury Spread 186.0 +18 basis points
  • M1 Money Supply $2.257 Trillion +1.79%
  • Commercial Paper Outstanding 1,008.5 +1.5%
  • 4-Week Moving Average of Jobless Claims 370,000 -5,000
  • Continuing Claims Unemployment Rate 2.6% unch.
  • Average 30-Year Mortgage Rate 3.79% -1 basis point
  • Weekly Mortgage Applications 804.90 +3.78%
  • Bloomberg Consumer Comfort -42.0 +1.6 points
  • Weekly Retail Sales +3.0% -10 basis points
  • Nationwide Gas $3.65/gallon -.06/gallon
  • U.S. Cooling Demand Next 7 Days 33.0% above normal
  • Baltic Dry Index 1,034 -9.38%
  • Oil Tanker Rate(Arabian Gulf to U.S. Gulf Coast) 37.50 -6.25%
  • Rail Freight Carloads 241,664 +1.12%
Best Performing Style
  • Mid-Cap Growth +3.42%
Worst Performing Style
  • Large-Cap Value +1.58%
Leading Sectors
  • Oil Tankers +7.47%
  • Homebuilders +7.46%
  • Gold & Silver +6.81%
  • Airlines +5.85%
  • HMOs +5.54%
Lagging Sectors
  • Defense +.66%
  • Computer Services +.11%
  • Drugs -.26%
  • Disk Drives -1.28%
  • Computer Hardware -2.78%
Weekly High-Volume Stock Gainers (10)
  • CBE, ARBA, AFCE, BNHN, PETM, RA, DSW, ALXN, SQI and CBRL
Weekly High-Volume Stock Losers (12)
  • JAKK, TIF, SURW, SMS, EXLS, GMAN, IMPV, MNRO, NTAP, DELL, EXPR and CNSL
Weekly Charts
ETFs
Stocks
*5-Day Change

Wednesday, May 23, 2012

Bear Radar


Style Underperformer:

  • Mid-Cap Growth -1.50%
Sector Underperformers:
  • 1) Computer -3.72% 2) Oil Tankers -3.61% 3) Agriculture -2.10%
Stocks Falling on Unusual Volume:
  • EXLS, CNSL, DELL, SURW, GHDX, SCMR, ANGI, NDAQ, ALXN, AMLN, VLTR, CREE, RYAAY, INTC, AFAM, LBTYA, IART, ABMD, MSFT, ET, CPN, SLV, GCO, SIL, JNPR, ALR, KMI, FAS, HPQ, RHT, RAH and DY
Stocks With Unusual Put Option Activity:
  • 1) BLK 2) GES 3) APC 4) WHR 5) LYB
Stocks With Most Negative News Mentions:
  • 1) NDAQ 2) MS 3) TIF 4) XOM 5) DELL
Charts:

Bull Radar


Style Outperformer:
  • Large-Cap Growth -1.05%
Sector Outperformers:
  • 1) Restaurants -.35% 2) Retail -.56% 3) Education -.71%
Stocks Rising on Unusual Volume:
  • PETM, TTWO, AVGO, EXPE, MOV and GES
Stocks With Unusual Call Option Activity:
  • 1) ARBA 2) AEO 3) DELL 4) DMND 5) HPQ
Stocks With Most Positive News Mentions:
  • 1) SBUX 2) PETM 3) ADI 4) LMT 5) JAZZ
Charts: