Portfolio Manager's Commentary on Investing and Trading in the U.S. Financial Markets
Sunday, December 30, 2012
Weekly Outlook
U.S. Week Ahead by MarketWatch (video).
Wall St. Week Ahead by Reuters.
Weekly Economic Calendar by Briefing.com.
BOTTOM LINE: I expect US stocks to finish the week modestly lower on rising US fiscal cliff concerns, Eurozone debt angst, technical selling, more shorting and global growth fears. My intermediate-term trading indicators are giving neutral signals and the Portfolio is 25% net long heading into the week.
Friday, December 28, 2012
Weekly Scoreboard*
Indices
ETFs
Stocks
*5-Day Change
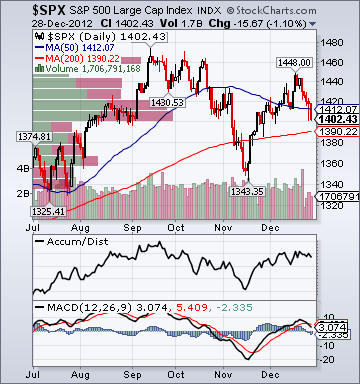
- S&P 500 1,402.43 -2.86%
- DJIA 12,938.11 -2.81%
- NASDAQ 2,960.31 -2.95%
- Russell 2000 832.10 -2.39%
- Value Line Geometric(broad market) 361.11 -2.60%
- Russell 1000 Growth 646.70 -2.75%
- Russell 1000 Value 705.27 -2.87%
- Morgan Stanley Consumer 826.75 -2.61%
- Morgan Stanley Cyclical 1,024.37 -2.64%
- Morgan Stanley Technology 673.04 -3.46%
- Transports 5,220.98 -2.55%
- Utilities 446.70 -2.92%
- Bloomberg European Bank/Financial Services 89.49 -1.65%
- MSCI Emerging Markets 43.61 +.40%
- Lyxor L/S Equity Long Bias 1,074.97 -.17%
- Lyxor L/S Equity Variable Bias 805.25 -.18%
- NYSE Cumulative A/D Line 158,018 -1.88%
- Bloomberg New Highs-Lows Index -91 -403
- Bloomberg Crude Oil % Bulls 50.0 +39.7%
- CFTC Oil Net Speculative Position 194,707 +6.45%
- CFTC Oil Total Open Interest 1,476,652 -1.15%
- Total Put/Call 1.06 +1.92%
- OEX Put/Call .57 -46.73%
- ISE Sentiment 85.0 -59.13%
- NYSE Arms 2.14 +224.24%
- Volatility(VIX) 22.72 +28.58%
- S&P 500 Implied Correlation 71.38 +10.53%
- G7 Currency Volatility (VXY) 8.14 +5.03%
- Smart Money Flow Index 10,913.17 -.68%
- Money Mkt Mutual Fund Assets $2.665 Trillion +1.1%
- AAII % Bulls 44.4 -4.3%
- AAII % Bears 30.2 +21.9%
- CRB Index 294.78 +.10%
- Crude Oil 90.80 +.95%
- Reformulated Gasoline 279.99 +1.50%
- Natural Gas 3.47 +.67%
- Heating Oil 304.48 -.42%
- Gold 1,655.90 +.47%
- Bloomberg Base Metals Index 211.72 +.57%
- Copper 358.95 +1.54%
- US No. 1 Heavy Melt Scrap Steel 349.67 USD/Ton unch.
- China Iron Ore Spot 139.40 USD/Ton +2.95%
- Lumber 378.50 +2.66%
- UBS-Bloomberg Agriculture 1,574.28 -.48%
- ECRI Weekly Leading Economic Index Growth Rate 5.4% +80 basis points
- Philly Fed ADS Real-Time Business Conditions Index .3922 -4.5%
- S&P 500 Blended Forward 12 Months Mean EPS Estimate 112.10 -.08%
- Citi US Economic Surprise Index 47.70 -7.1 points
- Fed Fund Futures imply 60.0% chance of no change, 40.0% chance of 25 basis point cut on 1/30
- US Dollar Index 79.68 +.53%
- Yield Curve 145.0 -4 basis points
- 10-Year US Treasury Yield 1.70% -6 basis points
- Federal Reserve's Balance Sheet $2.890 Trillion -.44%
- U.S. Sovereign Debt Credit Default Swap 36.0 -5.51%
- Illinois Municipal Debt Credit Default Swap 178.0 -1.16%
- Western Europe Sovereign Debt Credit Default Swap Index 110.43 +.26%
- Emerging Markets Sovereign Debt CDS Index 161.54 +.25%
- Israel Sovereign Debt Credit Default Swap 135.98 +1.99%
- Iraq Sovereign Debt Credit Default Swap 465.57 +1.92%
- China Blended Corporate Spread Index 369.0 +3 basis points
- 10-Year TIPS Spread 2.44% -4 basis points
- TED Spread 30.25 +4.75 basis points
- 2-Year Swap Spread 14.25 +1.25 basis points
- 3-Month EUR/USD Cross-Currency Basis Swap -21.25 +4.0 basis points
- N. America Investment Grade Credit Default Swap Index 95.52 +3.49%
- European Financial Sector Credit Default Swap Index 140.96 +1.53%
- Emerging Markets Credit Default Swap Index 210.49 -.24%
- CMBS Super Senior AAA 10-Year Treasury Spread 90.0 unch.
- M1 Money Supply $2.432 Trillion -1.80%
- Commercial Paper Outstanding 1,065.60 +.70%
- 4-Week Moving Average of Jobless Claims 356,800 -11,000
- Continuing Claims Unemployment Rate 2.5% unch.
- Average 30-Year Mortgage Rate 3.35% -2 basis points
- Weekly Mortgage Applications 817.0 n/a
- Bloomberg Consumer Comfort -32.1 -.2 point
- Weekly Retail Sales +2.40% +20 basis points
- Nationwide Gas $3.28/gallon +.05/gallon
- U.S. Heating Demand Next 7 Days n/a
- Baltic Dry Index 699.0 -8.75%
- China (Export) Containerized Freight Index 1,113.58 +.54%
- Oil Tanker Rate(Arabian Gulf to U.S. Gulf Coast) 27.50 unch.
- Rail Freight Carloads 240,119 -4.71%
- Small-Cap Growth -2.32%
- Large-Cap Value -2.87%
- Gold & Silver +.34%
- Steel -.61%
- I-Banking -.66%
- REITs -1.30%
- Papers -1.47%
- Tobacco -4.39%
- Oil Service -4.48%
- Disk Drives -5.15%
- Coal -5.42%
- Oil Tankers -5.59%
- F and KYTH
- SHEN, MED and CPMK
ETFs
Stocks
*5-Day Change
Sunday, December 23, 2012
Weekly Outlook
U.S. Week Ahead by MarketWatch (video).
Wall St. Week Ahead by Reuters.
Stocks to Watch Monday by MarketWatch.
Weekly Economic Calendar by Briefing.com.
BOTTOM LINE: I expect US stocks to finish the week modestly lower on rising US fiscal cliff concerns, Eurozone debt angst, technical selling, profit-taking, more shorting and global growth fears. My intermediate-term trading indicators are giving neutral signals and the Portfolio is 25% net long heading into the week.
Friday, December 21, 2012
Weekly Scoreboard*
Indices
ETFs
Stocks
*5-Day Change
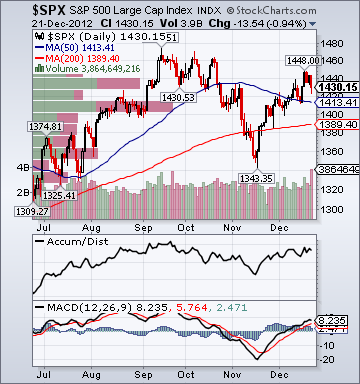
- S&P 500 1,430.15 +1.17%
- DJIA 13,190.84 +.42%
- NASDAQ 3,021.0 +1.67%
- Russell 2000 847.92 +2.93%
- Value Line Geometric(broad market) 367.82 +2.19%
- Russell 1000 Growth 659.79 +1.22%
- Russell 1000 Value 718.37 +1.24%
- Morgan Stanley Consumer 840.80 +.16%
- Morgan Stanley Cyclical 1,038.55 +1.84%
- Morgan Stanley Technology 689.99 +2.02%
- Transports 5,340.80 +2.97%
- Utilities 457.63 +1.45%
- Bloomberg European Bank/Financial Services 90.32 +1.43%
- MSCI Emerging Markets 43.0 -.65%
- Lyxor L/S Equity Long Bias 1,071.83 +.46%
- Lyxor L/S Equity Variable Bias 804.96 -.32%
- NYSE Cumulative A/D Line 162,086 +2.1%
- Bloomberg New Highs-Lows Index 312 +427
- Bloomberg Crude Oil % Bulls 35.8 +38.8%
- CFTC Oil Net Speculative Position 182,991 +9.96%
- CFTC Oil Total Open Interest 1,493,851 -3.21%
- Total Put/Call 1.04 +16.85%
- OEX Put/Call 1.07 -55.97%
- ISE Sentiment 98.0 -26.3%
- NYSE Arms 1.72 +82.98%
- Volatility(VIX) 17.84 +4.94%
- S&P 500 Implied Correlation 65.59 -.29%
- G7 Currency Volatility (VXY) 7.79 +5.84%
- Smart Money Flow Index 10,987.47 +1.15%
- Money Mkt Mutual Fund Assets $2.637 Trillion -.3%
- AAII % Bulls 46.4 +7.3%
- AAII % Bears 24.8 -17.6%
- CRB Index 294.13 -.26%
- Crude Oil 88.66 +2.13%
- Reformulated Gasoline 273.47 +2.73%
- Natural Gas 3.45 +4.45%
- Heating Oil 302.24 +1.28%
- Gold 1,660.10 -2.20%
- Bloomberg Base Metals Index 210.53 -3.0%
- Copper 356.70 -3.03%
- US No. 1 Heavy Melt Scrap Steel 349.67 USD/Ton unch.
- China Iron Ore Spot 135.40 USD/Ton +4.72%
- Lumber 366.60 +3.27%
- UBS-Bloomberg Agriculture 1,580.73 -1.76%
- ECRI Weekly Leading Economic Index Growth Rate 4.6% +70 basis points
- Philly Fed ADS Real-Time Business Conditions Index .3690 -8.32%
- S&P 500 Blended Forward 12 Months Mean EPS Estimate 112.19 -.03%
- Citi US Economic Surprise Index 54.80 +4.2 points
- Fed Fund Futures imply 58.0% chance of no change, 42.0% chance of 25 basis point cut on 1/30
- US Dollar Index 79.53 -.03%
- Yield Curve 149.0 +2 basis points
- 10-Year US Treasury Yield 1.76% +6 basis points
- Federal Reserve's Balance Sheet $2.902 Trillion +.11%
- U.S. Sovereign Debt Credit Default Swap 38.10 +2.25%
- Illinois Municipal Debt Credit Default Swap 180.0 +1.31%
- Western Europe Sovereign Debt Credit Default Swap Index 110.13 -.24%
- Emerging Markets Sovereign Debt CDS Index 161.15 -1.74%
- Israel Sovereign Debt Credit Default Swap 133.33 -4.31%
- Iraq Sovereign Debt Credit Default Swap 456.79 -3.84%
- China Blended Corporate Spread Index 366.0 -11 basis points
- 10-Year TIPS Spread 2.48% +2 basis points
- TED Spread 25.5 -2.75 basis points
- 2-Year Swap Spread 13.0 +.25 basis point
- 3-Month EUR/USD Cross-Currency Basis Swap -25.25 -2.75 basis points
- N. America Investment Grade Credit Default Swap Index 92.29 -3.09%
- European Financial Sector Credit Default Swap Index 138.83 -8.69%
- Emerging Markets Credit Default Swap Index 210.99 +.83%
- CMBS Super Senior AAA 10-Year Treasury Spread 90.0 unch.
- M1 Money Supply $2.476 Trillion +.33%
- Commercial Paper Outstanding 1,058.30 +.90%
- 4-Week Moving Average of Jobless Claims 367,800 -13,700
- Continuing Claims Unemployment Rate 2.5% unch.
- Average 30-Year Mortgage Rate 3.37% +5 basis points
- Weekly Mortgage Applications 817.0 -12.3%
- Bloomberg Consumer Comfort -31.9 +2.6 points
- Weekly Retail Sales +2.20% unch.
- Nationwide Gas $3.23/gallon -.06/gallon
- U.S. Heating Demand Next 7 Days 24.0% below normal
- Baltic Dry Index 708 -9.69%
- China (Export) Containerized Freight Index 1,107.55 +.55%
- Oil Tanker Rate(Arabian Gulf to U.S. Gulf Coast) 27.50 unch.
- Rail Freight Carloads 251,985 +4.95%
- Small-Cap Value +3.11%
- Large-Cap Growth +1.22%
- I-Banks +5.6%
- Homebuilders +4.2%
- Banks +4.1%
- Oil Tankers +4.02%
- Networking +4.0%
- Telecom -.39%
- Retail -.76%
- Education -2.0%
- Gold & Silver -2.70%
- Coal -3.19%
- ROMA, NYX, CBOU, ELOQ, ARB, VVUS, SGI, CPWR, HSII, EGOV, QUAD, AH, VRTU, ISIS, SCSC, LOGM, ARII and ARRS
- NAV, RGR, ISRG, MKL, NUS, ARIA and AFFY
ETFs
Stocks
*5-Day Change
Subscribe to:
Comments (Atom)

