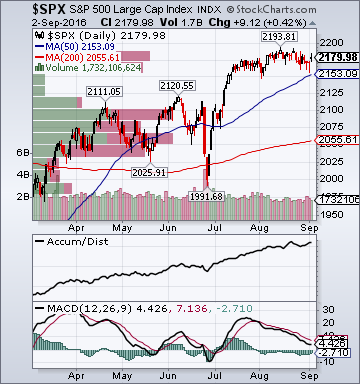
Indices
- Russell 2000 1,251.83 +1.11%
- S&P 500 High Beta 32.38 +.16%
- Goldman 50 Most Shorted 117.53 -.92%
- Wilshire 5000 22,579.75 +.65%
- Russell 1000 Growth 1,050.46 +.28%
- Russell 1000 Value 1,048.72 +.92%
- S&P 500 Consumer Staples 560.25 +.89%
- Solactive US Cyclical 141.38 +.51%
- Morgan Stanley Technology 1,188.64 +.42%
- Transports 7,946.79 +1.56%
- Bloomberg European Bank/Financial Services 79.57 +5.86%
- MSCI Emerging Markets 37.04 +.39%
- HFRX Equity Hedge 1,132.02 -.14%
- HFRX Equity Market Neutral 998.68 -.02%
Sentiment/Internals
- NYSE Cumulative A/D Line 270,565 +.75%
- Bloomberg New Highs-Lows Index 89 -10
- Bloomberg Crude Oil % Bulls 17.14 +82.73%
- CFTC Oil Net Speculative Position 341,288 -3.52%
- CFTC Oil Total Open Interest 1,787,891 +2.31%
- Total Put/Call .95 -8.65%
- ISE Sentiment 81.0 -25.0%
- Volatility(VIX) 11.98 -12.23%
- S&P 500 Implied Correlation 44.44 -3.78%
- G7 Currency Volatility (VXY) 10.05 -3.55%
- Emerging Markets Currency Volatility (EM-VXY) 9.77 -4.03%
- Smart Money Flow Index 19,485.19 -.16%
- ICI Money Mkt Mutual Fund Assets $2.724 Trillion -.38%
- ICI US Equity Weekly Net New Cash Flow -$4.572 Billion
Futures Spot Prices
- Reformulated Gasoline 130.16 -8.32%
- Heating Oil 140.96 -5.85%
- Bloomberg Base Metals Index 148.99 -.20%
- US No. 1 Heavy Melt Scrap Steel 209.33 USD/Ton unch.
- China Iron Ore Spot 59.39 USD/Ton +.44%
- UBS-Bloomberg Agriculture 1,123.18 -1.52%
Economy
- Atlanta Fed GDPNow Forecast +3.5% +10.0 basis points
- ECRI Weekly Leading Economic Index Growth Rate +8.1% unch.
- Philly Fed ADS Real-Time Business Conditions Index .0492 -17.86%
- S&P 500 Blended Forward 12 Months Mean EPS Estimate 127.61 +.22%
- Citi US Economic Surprise Index .6 -10.5 points
- Citi Eurozone Economic Surprise Index -4.1 -17.1 points
- Citi Emerging Markets Economic Surprise Index -4.90 -1.3 points
- Fed Fund Futures imply 68.0% chance of no change, 32.0% chance of 25 basis point hike on 9/21
- US Dollar Index 95.45 +.79%
- MSCI Emerging Markets Currency Index 1,534.50 -.62%
- Euro/Yen Carry Return Index 121.14 +1.74%
- Yield Curve 82.0 +3.0 basis points
- 10-Year US Treasury Yield 1.60% -3.0 basis points
- Federal Reserve's Balance Sheet $4.417 Trillion +.16%
- U.S. Sovereign Debt Credit Default Swap 26.21 -1.07%
- Illinois Municipal Debt Credit Default Swap 356.0 +.03%
- Western Europe Sovereign Debt Credit Default Swap Index 24.57 -.28%
- Asia Pacific Sovereign Debt Credit Default Swap Index 38.50 -4.41%
- Emerging Markets Sovereign Debt CDS Index 106.93 -2.27%
- Israel Sovereign Debt Credit Default Swap 68.0 1.45%
- Iraq Sovereign Debt Credit Default Swap 734.11 -14.32%
- Russia Sovereign Debt Credit Default Swap 214.66 -4.07%
- iBoxx Offshore RMB China Corporate High Yield Index 131.39 -.22%
- 10-Year TIPS Spread 1.48% -1.0 basis point
- TED Spread 52.0 +1.0 basis point
- 2-Year Swap Spread 24.5 +2.5 basis points
- 3-Month EUR/USD Cross-Currency Basis Swap -38.75 +1.0 basis point
- N. America Investment Grade Credit Default Swap Index 72.09 +3.39%
- America Energy Sector High-Yield Credit Default Swap Index 703.0 +2.14%
- European Financial Sector Credit Default Swap Index 87.76 -2.11%
- Emerging Markets Credit Default Swap Index 242.27 -.31%
- CMBS AAA Super Senior 10-Year Treasury Spread to Swaps 137.50 unch.
- M1 Money Supply $3.354 Trillion +.78%
- Commercial Paper Outstanding 981.30 -2.30%
- 4-Week Moving Average of Jobless Claims 263,000 -1,000
- Continuing Claims Unemployment Rate 1.6% unch.
- Average 30-Year Mortgage Rate 3.46% +3.0 basis points
- Weekly Mortgage Applications 545.20 +2.85%
- Bloomberg Consumer Comfort 43.4 -1.9 points
- Weekly Retail Sales +.4% +10.0 basis points
- Nationwide Gas $2.21/gallon unch.
- Baltic Dry Index 720.0 +.28%
- China (Export) Containerized Freight Index 694.59 -1.51%
- Oil Tanker Rate(Arabian Gulf to U.S. Gulf Coast) 22.50 -10.0%
- Rail Freight Carloads 270,012 +3.44%
Best Performing Style
Worst Performing Style
Leading Sectors
Lagging Sectors
Weekly High-Volume Stock Gainers (19)
- PI, KPTI, PAHC, CFI, AIR, MATX, VRA, BLOX, MTRX, OXM, SBCF, GEF, BOX, SYRS, CHS, WRLD, ININ, SYNA and NLS
Weekly High-Volume Stock Losers (17)
- FIVE, DSW, HSY, HRB, NCS, FRED, PAY, CORE, SCSC, CYTK, AVAV, SCTY, GIII, VEC, ANF, GCO and DVAX
Weekly Charts
ETFs
Stocks
*5-Day Change
