 |
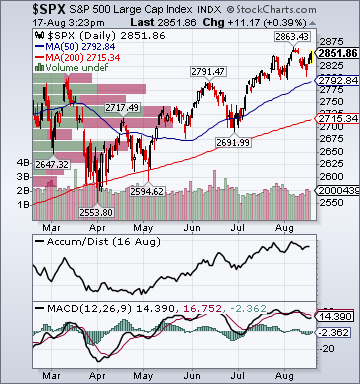
S&P 500 2,853.88 +.75% |
Indices
- DJIA 25,696.40 +1.53%
- NASDAQ 7,821.03 -.24%
- Russell 2000 1,693.49 +.41%
- S&P 500 High Beta 43.83 -.43%
- Goldman 50 Most Shorted 170.79 -1.08%
- Wilshire 5000 29,622.0 +.60%
- Russell 1000 Growth 1,515.71 +.38%
- Russell 1000 Value 1,239.99 +1.03%
- S&P 500 Consumer Staples 564.12 +3.28%
- Vanda Cyclicals-Defensives 1.6008 -2.38%
- NYSE Technology 1,853.75 -2.14%
- Transports 11,232.70 +1.29%
- Utilities 744.28 +2.89%
- Bloomberg European Bank/Financial Services 84.98 -3.05%
- MSCI Emerging Markets 41.99 -3.25%
- HFRX Equity Hedge 1,255.09 -1.10%
- HFRX Equity Market Neutral 1,007.62 +.24%
Sentiment/Internals
- NYSE Cumulative A/D Line 329,063 -.17%
- Bloomberg New Highs-Lows Index -184 -258
- Bloomberg Crude Oil % Bulls 19.44 -22.24%
- CFTC Oil Net Speculative Position 608,927 -.73%
- CFTC Oil Total Open Interest 2,342,575 -.28%
- Total Put/Call 1.04 -15.0%
- OEX Put/Call 1.98 +261.70%
- ISE Sentiment 240.0 +161.54%
- NYSE Arms .66 -48.90%
- Volatility(VIX) 12.46 -4.41%
- S&P 500 Implied Correlation 29.31 -7.07%
- G7 Currency Volatility (VXY) 7.88 -1.62%
- Emerging Markets Currency Volatility (EM-VXY) 12.48 +2.72%
- Smart Money Flow Index 16,313.82 +.49%
- ICI Money Mkt Mutual Fund Assets $2.860 Trillion -.13%
- ICI Domestic Equity Mutual Fund/ETFs Weekly Flows -$3.407 Billion
- AAII % Bulls 36.2 -.5%
- AAII % Bears 29.1 -6.3%
Futures Spot Prices
- CRB Index 188.74 -1.54%
- Crude Oil 66.02 -2.60%
- Reformulated Gasoline 198.10 -2.93%
- Natural Gas 2.95 +.38%
- Heating Oil 210.15 -2.06%
- Gold 1,183.30 -2.57%
- Bloomberg Base Metals Index 178.30 -4.15%
- Copper 266.40 -3.17%
- US No. 1 Heavy Melt Scrap Steel 324.33 USD/Metric Tonne -5.08%
- China Iron Ore Spot 67.60 USD/Metric Tonne -2.06%
- Lumber 472.50 +13.72%
- UBS-Bloomberg Agriculture 932.70 +.13%
Economy
- Atlanta Fed GDPNow Forecast +4.25% -5.0 basis points
- ECRI Weekly Leading Economic Index Growth Rate .3% -30.0 basis points
- Philly Fed ADS Real-Time Business Conditions Index .0782 -1.26%
- US Economic Policy Uncertainty Index 17.63 -83.84%
- S&P 500 Blended Forward 12 Months Mean EPS Estimate 171.62 +.26%
- Citi US Economic Surprise Index -16.30 -4.4 points
- Citi Eurozone Economic Surprise Index -16.30 +16.6 points
- Citi Emerging Markets Economic Surprise Index -9.4 -6.7 points
- Fed Fund Futures imply 10.0% chance of no change, 90.0% chance of 25 basis point hike on 9/26
- US Dollar Index 96.30 +.03%
- MSCI Emerging Markets Currency Index 1,591.31 -.71%
- Bitcoin/USD 6,509.82 +5.53%
- Euro/Yen Carry Return Index 131.32 -.42%
- Yield Curve 24.75 -1.5 basis points
- 10-Year US Treasury Yield 2.86%-1.0 basis point
- Federal Reserve's Balance Sheet $4.190 Trillion -.68%
- U.S. Sovereign Debt Credit Default Swap 22.10 +13.22%
- Illinois Municipal Debt Credit Default Swap 207.38 +2.86%
- Italian/German 10Y Yld Spread 281.5 +13.75 basis points
- Asia Pacific Sovereign Debt Credit Default Swap Index 11.10 +4.73%
- Emerging Markets Sovereign Debt CDS Index 147.60 +39.9%
- Israel Sovereign Debt Credit Default Swap 69.97 +.5%
- South Korea Sovereign Debt Credit Default Swap 42.08 -.98%
- Russia Sovereign Debt Credit Default Swap 163.02 -4.29%
- iBoxx Offshore RMB China Corporate High Yield Index 150.75 -.05%
- 10-Year TIPS Spread 2.09% -1.0 basis point
- TED Spread 29.0 -1.25 basis points
- 2-Year Swap Spread 20.0 +.75 basis point
- 3-Month EUR/USD Cross-Currency Basis Swap -9.5 +1.75 basis points
- N. America Investment Grade Credit Default Swap Index 61.74 +1.16%
- America Energy Sector High-Yield Credit Default Swap Index 415.0 +11.98%
- European Financial Sector Credit Default Swap Index 86.60 +2.90%
- Emerging Markets Credit Default Swap Index 205.98 +3.86%
- CMBS AAA Super Senior 10-Year Treasury Spread to Swaps 180.0 unch.
- M1 Money Supply $3.649 Trillion -.56%
- Commercial Paper Outstanding 1,055.30 -1.6%
- 4-Week Moving Average of Jobless Claims 215,500 +1,250
- Continuing Claims Unemployment Rate 1.2% unch.
- Average 30-Year Mortgage Rate 4.53% -6.0 basis points
- Weekly Mortgage Applications 335.80 -1.96%
- Bloomberg Consumer Comfort 58.9 -.4 point
- Weekly Retail Sales +4.50% +30.0 basis points
- Nationwide Gas $2.85/gallon -.02/gallon
- Baltic Dry Index 1,720.0 +1.72%
- China (Export) Containerized Freight Index 831.29 +.91%
- Oil Tanker Rate(Arabian Gulf to U.S. Gulf Coast) 25.0 unch.
- Rail Freight Carloads 285,169 -2.03%
Best Performing Style
- Large-Cap Value +.7%
Worst Performing Style
- Small-Cap Growth -.3%
Leading Sectors
- Telecom +3.2%
- Utilities +2.9%
- Foods +2.7%
- Healthcare Providers +2.3%
- Restaurants +2.2%
Lagging Sectors
- Social Media -4.3%
- Shipping -4.5%
- Education -4.5%
- Oil Service -6.6%
- Gold & Silver -12.1%
Weekly High-Volume Stock Gainers (2)
- CATM and RYAM
Weekly High-Volume Stock Losers (5)
- EAF, THO, GILD, AMAT and TSLA
Weekly Charts
ETFs
Stocks
*5-Day Change