 |
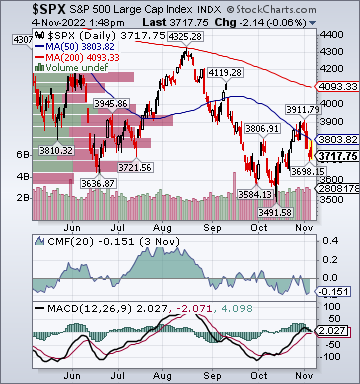
| S&P 500 3,723.28 -4.6% |
Weekly Market Wrap by Edward Jones.
Indices
- DJIA 31,990.9 -2.5%
- NASDAQ 10,280.41 -7.2%
- Russell 2000 1,775.44 -3.9%
- S&P 500 High Beta 60.2 -4.4%
- Goldman 50 Most Shorted 158.32 -9.2%
- Wilshire 5000 37,423.28 -4.6%
- Russell 1000 Growth 2,099.28 -7.1%
- Russell 1000 Value 1,447.74 -2.4%
- S&P 500 Consumer Staples 738.83 -2.8%
- MSCI Cyclicals-Defensives Spread 1,004.17 -4.6%
- NYSE Technology 2,447.0 -6.1%
- Transports 13,270.64 -2.1%
- Utilities 900.54 -2.2%
- Bloomberg European Bank/Financial Services 72.2 +3.7%
- MSCI Emerging Markets 35.86 +4.5%
- HFRX Equity Hedge 1,434.46 -.15%
- HFRX Equity Market Neutral 917.45 -.06%
Sentiment/Internals
- NYSE Cumulative A/D Line 440,327 -.21%
- Bloomberg New Highs-Lows Index -639 -498
- Crude Oil Commercial Bullish % Net Position -32.1 +1.2%
- CFTC Oil Net Speculative Position 249,079 -.98%
- CFTC Oil Total Open Interest 1,436,942 -1.2%
- Total Put/Call .97 +3.2%
- OEX Put/Call .97 -8.6%
- ISE Sentiment 90.0 -8.0 points
- NYSE Arms .82 -17.0%
- Bloomberg Global Risk-On/Risk-Off Index 50.4 +10.0%
- Bloomberg Financial Conditions Index + Bubbles 1.58 -3.0 basis points
- Volatility(VIX) 25.1 -2.3%
- DJIA Intraday % Swing 2.1% +5.0%
- CBOE S&P 500 Implied Correlation Index 50.5 -3.9%
- G7 Currency Volatility (VXY) 11.8 +1.2%
- Emerging Markets Currency Volatility (EM-VXY) 12.3 -4.1%
- Smart Money Flow Index 13,894.17 -.44%
- NAAIM Exposure Index 55.2 +1.3 points
- ICI Money Mkt Mutual Fund Assets $4.632 Trillion +1.0%
- ICI Domestic Equity Long-Term Mutual Fund/ETFs Weekly Flows +$10.939 Million
- AAII % Bulls 30.6 +15.0%
- AAII % Bears 32.9 -28.0%
Futures Spot Prices
- CRB Index 278.32 +2.1%
- Crude Oil 92.1 +4.2%
- Reformulated Gasoline 272.77 +7.2%
- Natural Gas 6.20 +7.2%
- Dutch TTF Nat Gas(European benchmark) 114.79 euros/megawatt-hour +5.0%
- Heating Oil 393.82 -15.7%
- Newcastle Coal 350.5 (1,000/metric ton) -7.9%
- Gold 1,673.33 +1.7%
- Silver 20.74 +7.6%
- S&P GSCI Industrial Metals Index 407.7 +.75%
- Copper 368.65 +7.3%
- US No. 1 Heavy Melt Scrap Steel 350.0 USD/Metric Tonne -3.8%
- China Iron Ore Spot 87.20 USD/Metric Tonne +12.8
%
- Lumber 425.0 -9.0%
- UBS-Bloomberg Agriculture 1,533.02 +4.0%
- US Gulf NOLA Potash Spot 535.0 USD/Short Ton -6.1%
Economy
- Atlanta Fed GDPNow Forecast +3.60% +52.0 basis points
- ECRI Weekly Leading Economic Index Growth Rate -15.1% -1.0 percentage point
- Bloomberg US Recession Probability Next 12 Months 60.0% unch.
- NY Fed Real-Time Weekly Economic Index 2.23 -4.3%
- US Economic Policy Uncertainty Index 144.30 +60.6%
- S&P 500 Blended Forward 12 Months Mean EPS Estimate 231.66 -1.21: Growth Rate +12.1% -2.4 percentage points, P/E 16.0 -.6 point
- Citi US Economic Surprise Index 18.9 +4.4 points
- Citi Eurozone Economic Surprise Index 9.2 +.2 point
- Citi Emerging Markets Economic Surprise Index 1.7 -6.5 points
- Fed Fund Futures imply 0.0%(-8.4 percentage points) chance of +25.0 basis point rate hike, 56.8%(+8.4 percentage points) chance of +50.0 basis point hike and 43.2%(-.2 percentage point) chance of +75.0 basis point hike on 12/14 to 4.50-4.75%
- US Dollar Index 111.26 +.5%
- MSCI Emerging Markets Currency Index 1,578.85 -.16%
- Bitcoin/USD 20,770.1 +.3%
- Euro/Yen Carry Return Index 150.6 -.76%
- Yield Curve(2s/10s) -51.25 -10.75 basis points
- 10-Year US Treasury Yield 4.16% +16.0 basis points
- Federal Reserve's Balance Sheet $8.642 Trillion -.53%
- U.S. Sovereign Debt Credit Default Swap 29.12 +3.4%
- Illinois Municipal Debt Credit Default Swap 190.30 -1.1%
- Italian/German 10Y Yld Spread 217.0 +10.0 basis points
- UK Sovereign Debt Credit Default Swap 27.4 -3.5%
- China Sovereign Debt Credit Default Swap 104.73 -11.5%
- Brazil Sovereign Debt Credit Default Swap 262.22 -6.1%
- Israel Sovereign Debt Credit Default Swap 37.74 +2.4%
- South Korea Sovereign Debt Credit Default Swap 73.20 +10.9%
- China Corp. High-Yield Bond USD ETF(KHYB) 23.91 -.27%
- Atlanta Fed Low Skill Wage Growth Tracker YoY +6.4% unch.
- Zillow US All Homes Rent Index YoY +11.0% unch.
- US Urban Consumers Food CPI YoY +11.2% unch.
- Cleveland Fed Inflation Nowcast Core PCE YoY +5.16% unch.: CPI YoY +8.09% -2.0 basis points
- 10-Year TIPS Spread 2.46% -5.0 basis points
- TED Spread 41.0 +3.25 basis points
- 2-Year Swap Spread 36.75 -1.25 basis points
- 3-Month EUR/USD Cross-Currency Basis Swap -53.75 -1.25 basis points
- N. America Investment Grade Credit Default Swap Index 92.53 +4.6%
- America Energy Sector High-Yield Credit Default Swap Index 305.0 -2.3%
- Bloomberg TRACE # Distressed Bonds Traded 500.0 +45.0
- European Financial Sector Credit Default Swap Index 119.73 -1.6%
- Credit Suisse Subordinated 5Y Credit Default Swap 365.95 +9.9%
- Emerging Markets Credit Default Swap Index 282.93 -.80%
- MBS 5/10 Treasury Spread 172.0 +5.0 basis points
- Aggregate US CMBS Average OAS 1.31 +2.0 basis points
- Avg. Auto ABS OAS 1.13 +4.0 basis points
- M2 Money Supply YoY % Change 2.6 unch.
- Commercial Paper Outstanding 1,300.5 unch.
- 4-Week Moving Average of Jobless Claims 219,000 +3.2%
- Continuing Claims Unemployment Rate 1.0% unch.
- Kastle Back-to-Work Barometer(entries in secured buildings) 47.60 -.54%
- Average 30-Year Fixed Home Mortgage Rate 7.35% +25.0 basis points
- Weekly Mortgage Applications 200,100 -.55%
- Weekly Retail Sales +8.5% +30.0 basis points
- OpenTable US Seated Diners % Change from 2019 -4.0% -51.9 percentage points
- Box Office Weekly Gross $144.2M +50.4%
- Nationwide Gas $3.79/gallon +.03/gallon
- Baltic Dry Index 1,290 -15.9%
- China (Export) Containerized Freight Index 1,790.86 -3.8%
- Oil Tanker Rate(Arabian Gulf to U.S. Gulf Coast) 57.50 +4.5%
- Truckstop.com Market Demand Index 36.0 +1.3%
- Rail Freight Carloads 270,032 +.81%
- TSA Total Traveler Throughput 2,236,880 +22.3%
- US Covid-19: 84
infections/100K people(last 7 days total). 4.8%(+.4 percentage point)
of peak on 1/14/22(1,740) +7/100K people from prior report
- US Covid-19: New patient hospital admissions per 100K -84.8%(-.1 percentage point) from peak 7-day avg. of 1/9/22-1/15/22
Best Performing Style
- Large-Cap Value -2.4%
Worst Performing Style
- Large-Cap Growth -7.1%
Leading Sectors
- Steel +5.1%
- Oil Service +4.6%
- Shipping +4.1%
- Electric Vehicles +3.8%
- Energy +2.4%
Lagging Sectors
- Homebuilers -6.2%
- Networking -7.9%
- Software -9.9%
- Cyber Security -10.8%
- Internet -11.8%
Weekly High-Volume Stock Gainers (6)
- PODD, COLD, KMPR, ANET, TSE and DASH
Weekly High-Volume Stock Losers (74)
- ROG,
CE, TRIN, PCTY, DISH, ETV, GLOB, SBGI, GDYN, KEYS, LYV, SEM, PARA,
ETSY, VRRM, PANW, AVB, PYPL, NSSC, NICE, NXST, OTEX, CYBR, AFRM, ACAD,
QTWO, CRM, EVH, VRNS, IRTC, DDOG, PTCT, NOW, WDAY, ROKU, CHWY, DOCN,
OGN, TNDM, GDDY, PAAS, PAYC, FIVN, CRWD, MDB, ZS, CFLT, ZI, BILL, RPD,
NCNO, OKTA, ESTC, S, HCP, FROG, SNOW, COUP, GTLB, MNDY, FA, WBD, SMAR,
YELP, CDNA, FRG, NET, DH, APPN, CYRX, VIAV, TEAM, TWLO and SYNH
ETFs
Stocks
*5-Day Change
No comments:
Post a Comment